Dealing with Syslog Device in KHIKA
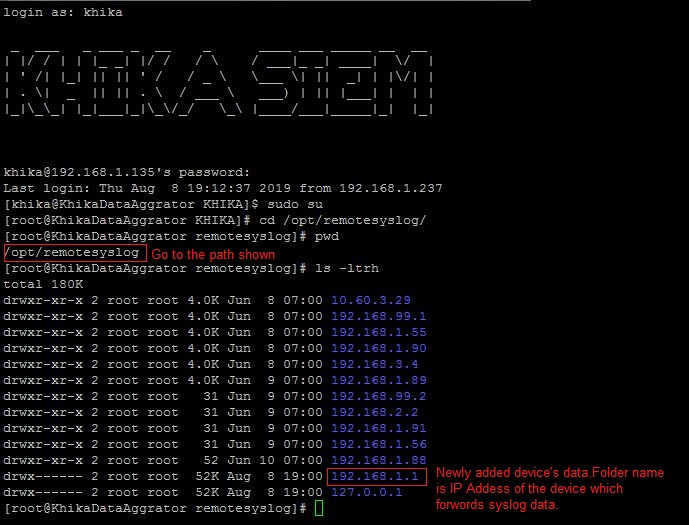
Syslog service is pre-configured on your KHIKA aggregator server (on UDP port 514). Syslogs are stored in /opt/remotesylog directory with IP address of the sending device as directory name for each device sending data. This way, data of each device is stored in a distinct directory and files. For example, if you are sending syslogs from your firewall which as IP of 192.168.1.1, you will see a directory with the name /opt/remotesylog/192.168.1.1 on KHIKA Data Aggregator. The files will be created in this directory with the date and time stamp <example : 2019-08-08.log>. If you do a "tail -f" on the latest file, you will see live logs coming in.
When you want to add a new device into KHIKA, perform following steps
1. Note the IP address of your KHIKA Data Aggregator.
2. Please refer to OEM documentation on how to enable Syslogs. We encourage you to enable the lowest level of logging so that you capture all the details. Syslog server where logs should go is IP address of your KHIKA Data Aggregator and port should be UDP 514.
   For enable syslog of preconfigured apps in KHIKA click on the below link:
   • Symantec Antivirus
   • Cisco Switch
   • Checkpoint Firewall
   • Fortigate Firewall
   • PaloAlto Firewall
   • Sophos Firewall
3. Note the IP address of the device sending the logs (example 192.168.1.1)
4. Now go to KHIKA Data Aggregator and login as "khika" user and do "sudo su".
5. cd to /opt/remotesylog and do "ls -ltr" here. If you see the directory with the name of the ip of the device sending the data, you have started receiving the data in syslogs.
Data is not receiving on Syslog Server
- please wait for some time.
- Some devices such as switches, routers, etc don’t create too many syslogs.
- It depends on the activity on the device. Try doing some activities such as login and issue some commands etc. The intention is to generate some syslogs.
- Check if logs are generating and being received on KHIKA Data Aggregator in the directory "/opt/remotesylog/ip_of_device". Do ls -ltrh
- If logs are still not being received, Please check the following points.
- Check firewall settings on KHIKA Data Aggregator. Wait for some time perform some actions on the end device to generate logs and check in directory /opt/remotesylog/ip_of_device. Do "ls -ltr"
   Check firewall status
   systemctl status firewalld
   If firewall status is active, then do the following commands to inactive and disable firewalld.
   systemctl stop firewalld
   systemctl disable firewalld
   Flush iptables
   sudo iptables –flush
- Check if there is any firewall between KHIKA Data Aggregator and allow communication from device to KHIKA Data Aggregator on port 514 (UDP)
- Login to KHIKA Data Aggregator and do tcpdump
sudo tcpdump -i any src <ip_of_ device> and port 514
If you see the packets being received by tcpdump, restart syslog service using command.
   systemctl syslog-ng stop, Then wait for some time.
   systemctl syslog-ng start
Make sure you are receiving the logs in the directory /opt/remotesylog/ip_of_device Go to Started Receiving the logs only after you start receiving the logs.
Started Receiving the logs
Now you need to add a device from KHIKA GUI.
If the similar device of a data source has already been added to KHIKA
- Add this device to the same Adapter using following steps explained here.
- Else, check if App for this device is available with KHIKA. If the App is available, load the App and then Add device to the adapter using the steps explained here.
- Else, develop a new Adapter (and perhaps a complete App) for this data source. Please read section on how to write your own adapter on Wiki, after writing your own adapter, testing it, you can configure the adapter and then start consuming data into KHIKA. Explore the data in KHIKA using KHIKA search interface

