KHIKA App for Linux
Contents
- 1 Introduction
- 2 How to Install the KHIKA App for Linux?
- 3 How to get your Linux data into KHIKA ?
- 4 Installing OSSEC Agent for Linux
- 5 Adding the device in the Adaptor
- 6 Extract key from KHIKA OSSEC Server
- 7 Insert unique OSSEC key in OSSEC Agent on the Linux Server
- 8 Reload Configuration
- 9 Verifying OSSEC data collection
- 10 How to check the output of KHIKA Linux App ?
Introduction
Linux servers run most critical business applications. Monitoring of Linux servers is important, from both security and operational standpoint. With KHIKA App for Linux servers, you can :
- Monitor syslogs to identify live attack vectors such as brute force attempts, weak ssh ciphers, communication with bad IPs and many others.
- Use Actionable dashboards showing gaps in secured configuration and hardening of the severs
- Do File integrity monitoring
- Monitor Superuser activities
We explain below steps to configure and interpret the output of KHIKA App for Linux Server. The key parts to get here are :
- Install the KHIKA App for Linux
- Get data from your Linux Server into KHIKA Aggregator
How to Install the KHIKA App for Linux?
It is assumed, that you have already configured KHIKA Data Aggregator in your environment. If not, please read how to configure KHIKA Data Aggregator and perform the pre-requisite steps.
This section explains how to pick and install the KHIKA application for Linux Servers. Installing the application shall put together and activate the adapter (parser) that can handle Linux data format, the dashboards and the alert rules preconfigured.
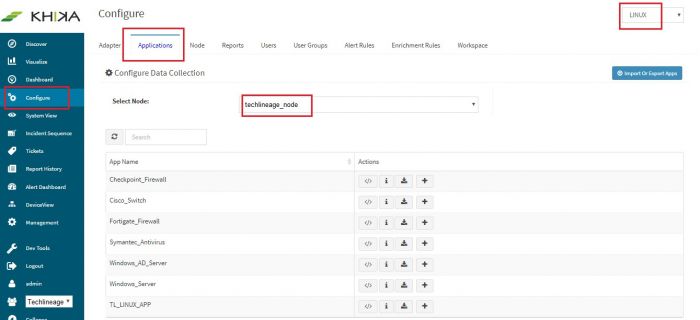
Go to “Applications” tab in the “Configure” menu.
Check whether the appropriate Workspace is selected. Note: Application is always loaded in a Workspace. Read the section on Workspaces to know more about KHIKA Workspaces. Also select your KHIKA aggregator name in the Node dropdown. This is to ensure that we are collecting data from the desired source and into the correct workspace which is ready with the configured application and components.
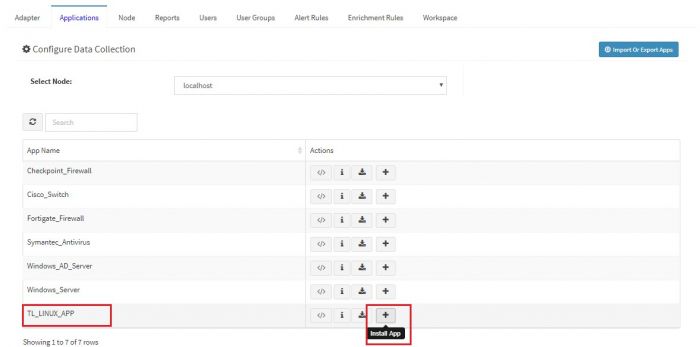
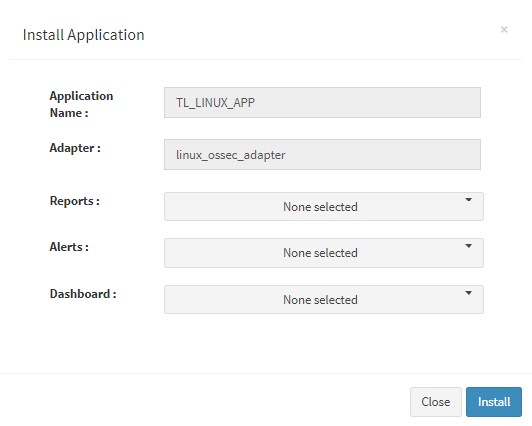
Click on the “+” button. A pop up appears.
User can now select the contents of the application required. For example, on the dropdown for “Reports”, click to expand it. List of all reports can be seen. User can individually select the reports required by checking on the checkbox next to each. Alternatively, check on “Select All” option to get all of them. Similarly you can select contents from Alerts and Dashboards.
What are KHIKA Reports What are KHIKA Dashboards What are KHIKA Alerts
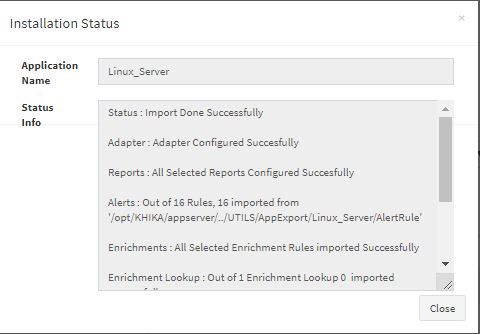
Click “OK” to proceed with the installation of the selected Application. After successful installation, following status should be displayed :
This simple procedure to install a KHIKA App, automatically configures the Adapter (required for parsing the data from raw syslogs), calculated KHIKA reports on raw data, Visualizations, Dashboards and Alerts – all in one click.
How to get your Linux data into KHIKA ?
KHIKA recommends, popular open source OSSEC integration to monitor the Linux servers. There are 2 components in OSSEC Integration with KHIKA.
- OSSEC Agent – Installed on each Linux server which we wish to monitor
- OSSEC Server – Present on KHIKA Data Aggregator (which you must install before)
The OSSEC agent and server communicate with each other using a unique key for encryption. The main steps to start getting data from a Linux server are
- Install Ossec agent on the Linux server
- Add the Linux server details in KHIKA
- Extract a unique key for this device from KHIKA
- Insert this key in the Ossec agent (ie. on your Linux server to be monitored)
- Reload Configuration
- Verify data collection
Each of these steps is explained in detail in the further sections.
Installing OSSEC Agent for Linux
Download Linux Ossec Agent from here.
For Linux Agent, Please check your OS version and select appropriate downloader file.
Version 5: ossec_TL_Agent_5.11.tar.gz
Version 6: ossec_TL_Agent_6.x.tar.gz
Version 7: ossec_TL_Agent.tar.gz
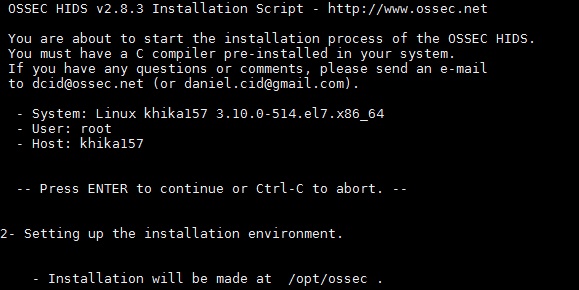
Copy the downloaded installer on your Linux server that you wish to monitor using KHIKA and run the installer with "root" credentials on the Server.
Please Note : It is extremely important to install the OSSEC agent with "root" privileges as this agent reads the /var/log/secure, /var/log/messages and some other important files. In order to read it successfully the ossec-agent process must be installed with "root" privileges.
You will have to run following command as "root" user to install the Ossec Agent :- Remove/rename ossec directory if already exists on the agent. ie. our Linux server.
mv /opt/ossec /opt/ossec_bak
Go to the location where you have copied the Ossec agent installer mentioned above. Extract it using the following command
tar –zxvf ossec_TL_Agent.tar.gz
Then go to that directory using the cd command. You shall see a script by the name install.sh
Then Run following command.
"sudo ./install.sh" (you need not do sudo if you have already logged in as root)
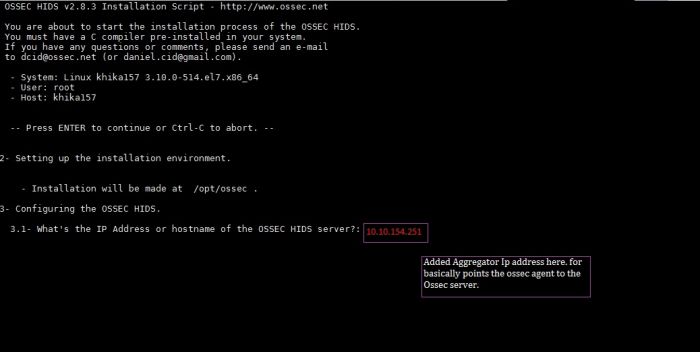
Now, add KHIKA Data Aggregator IP address (OSSEC server IP address) to point the OSSEC agent to the OSSEC server.
NOTE: You will have to repeat these steps on each of the Linux Servers that you wish to monitor using KHIKA.
Adding the device in the Adaptor
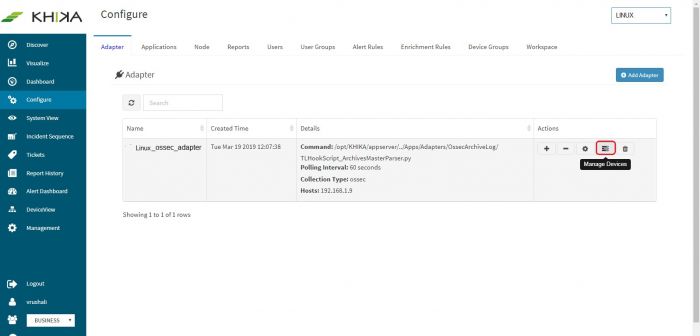
Go to Adapter tab in the “Configure” menu. Next to our “linux_ossec_adapter”, click on the “Manage Devices” icon.
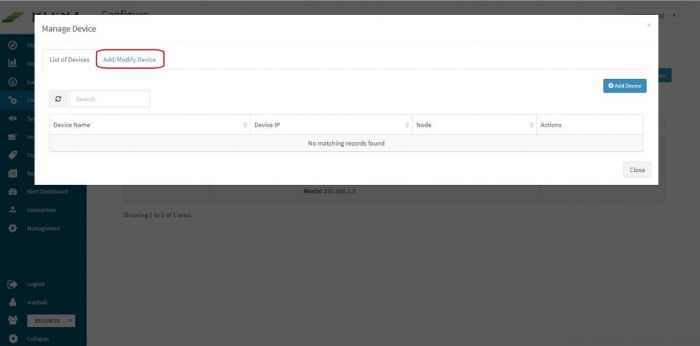
Pop up appears for device details
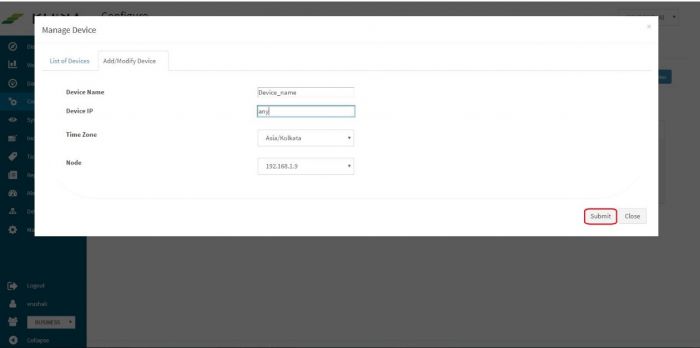
Click on “Add / Modify Device” tab. Another pop up appears for device details.
Enter the expected device name. Also, in the field for IP address, enter “any”. Please note: Always enter the IP Address as “any”. This is a safe and sure option to establish a connection with the server where we are suggesting ossec agent to use “any” of its configured IPs to be used to connect with the OSSEC Server. The device may have multiple NIC cards/IP addresses and unless we are sure of what IP will be used for connection, the connect will fail. Hence, it is safe to “any” as interface or IP address.
Select appropriate time zone of this device. In the “Node” field dropdown, select the name of the Aggregator or local data collector for this device.
Click on Submit. We get a success message and the linux server is added successfully to this adaptor.
Extract key from KHIKA OSSEC Server
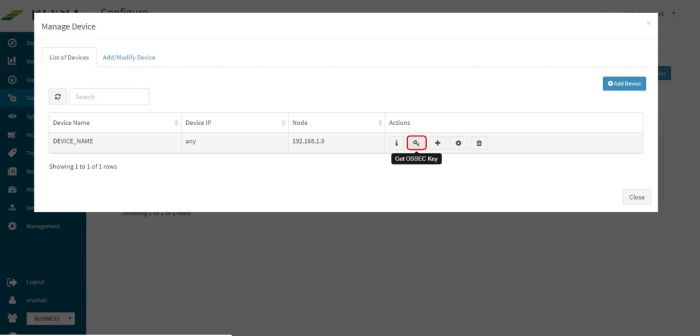
Now the expected Linux server is added in the required adapter. To see this device entry, click on “Manage Devices” icon next to the adapter.
A pop up with device details of the adaptor appears. Select “List of Devices” tab.
Click on the “Get OSSEC Key” icon next to this device.
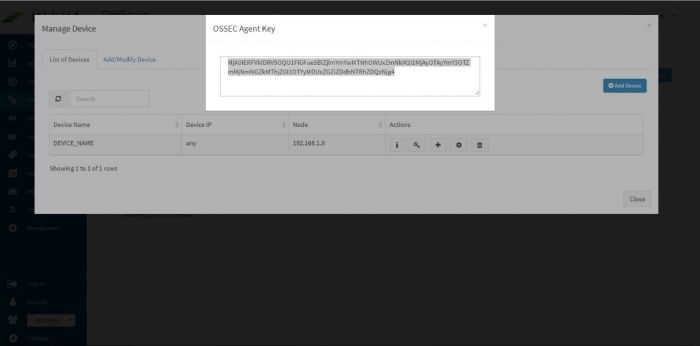
This is the unique key for this device created by the OSSEC server. Paste this key in the Ossec agent which is installed on this Linux server.
Insert unique OSSEC key in OSSEC Agent on the Linux Server
Perform following simple steps on the Linux Agent
- Login as "root" on the agent server
- Please note OSSEC Server listens on UDP port 1514 and the firewall between the ossec agent and ossec server must be open for UDP protocol and 1514 port.
- In the OSSEC Agent installation directory, run manage-agent script from
sudo /opt/ossec/bin/manage_agents
- You'll be presented with these options
Select "i" to import the key (which we created in above section, on the Ossec server)
- Copy and paste the key generated on the server
- Restart the agent using command /opt/ossec/bin/ossec-control restart
- Repeat these steps for all the servers to be monitored.
- Finally, go to Workspace tab and click on “Apply Configuration” icon.
Reload Configuration
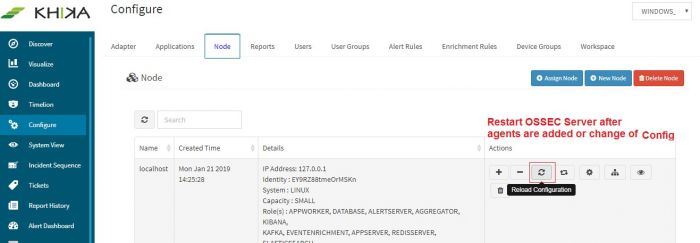
Login into the KHIKA portal.
- Go to Configure
- Select workspace, eg. LINUX_SERVERS
- Go to Node Tab
- Click Reload Config
This step restarts OSSEC Server. Wait for a few minutes for server to restart.
Verifying OSSEC data collection
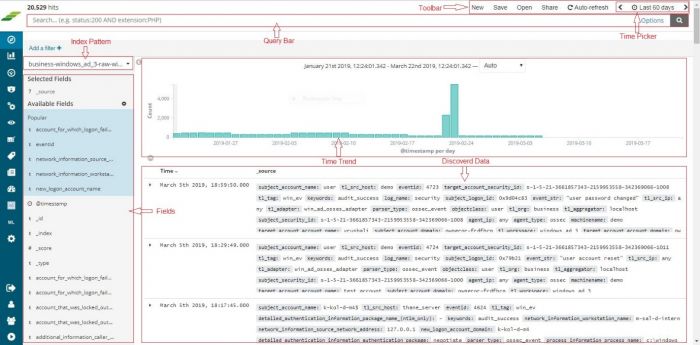
Once the device is added successfully, we can check the data for this device on Discover screen. Go to “Discover” from the main menu. Select the appropriate index for the same. Raw (khika formatted) data of all your Linux servers added in KHIKA so far, is seen here.
To see the data for our newly added device, enter search string in lower case – tl_src_host : name_of_the_device_added_in_lower_case and click on the search icon.
How to check the output of KHIKA Linux App ?
Linux Login Activity Dashboard
Go to "Dashboards" from the left menu. From the list of in-built dashboards, select this one. It shall open the Dashboard. This dashboard focuses on the login activity in the Linux servers in your system (which are added into KHIKA). Details like which user logged in how many times into which server, authentication information, login methods like SSH etc. is shown in an analytical fashion. You can filter and search information and create new ones too. For help with Dashboards, click here
Elements in the Dashboard are explained below :
| Visualization | Description |
| Logon Authentication pie chart | Contribution of success and failure authentication events |
| IP address wise Users bar graph | X axis : all the IP addresses from where users have logged into the Linux server(s) Y axis : Usernames and count of events |
| Time trend | Trend of login events over time. Useful to identify unusual spikes at a glance. X axis : date & time Y axis : count of events |
| Summary Table | Detailed data with timestamp and count |
Suggestion for useful interaction with this dashboard could be :
Click on “failed” login section in the Logon Authentication pie chart. This gets selected and a filter for “failed” is applied across the rest of the dashboard. The next bar shall show then the statistics of users who failed to login into the server and a high number of count on the y axis, may need attention. Details of “failed” login can be seen in the summary table. How to remove this filter is explained here
Linux File Integrity Dashboard
Go to "Dashboards" from the left menu. From the list of in-built dashboards, select this one. It shall open the Dashboard. Critical files in your system are monitored for any change / edit and real time alerts are fired if any such incident, as well as displayed, on this monitoring dashboard. You can filter and search information and create new ones too. For help with Dashboards, click here
Elements in the Dashboard are explained below :
| Visualization | Description |
| Contribution of Filename pie chart | Contribution of file names, as per the modification events happening on it. |
| Server wise contribution of Files Modified | X axis : on or more linux servers Y axis : stacked in each bar (server name) the names of files and count of events occurred for each file. |
| Time trend | Trend of login events over time. Useful to identify unusual spikes at a glance. X axis : date & time Y axis : count of events |
| Summary Table | Detailed data with timestamp and count |
A suggestion for useful interaction with this dashboard could be :
Examine the time trend, for higher number of events. If there has been any software update / patch activity at the time and still high number of events, click on that point in time on the time trend. Rest of the dashboard also gets filtered and we can isolate – the server on which this happened and the file names.
Linux Server Hardening Dashboard
Go to "Dashboards" from the left menu. From the list of in-built dashboards, select this one. It shall open the Dashboard. Server Hardening is the process of enhancing server security through a variety of means which results in a more secure server operating environment. This is due to the advanced security measures that are put in place during the server hardening process. KHIKA checks each server against out-of-box server hardening policies to ensure your servers are securely configured. It helps you to pinpoint and tune the exact details on hosts for better security posture. The server hardening policies against which the servers are checked can be seen here.
You can filter and search information and create new ones too. For help with Dashboards, click here
Elements in the Dashboard are explained below :
| Visualization | Description |
| Contribution of status pie chart | Failed or Passed compliance status |
| Server wise Hardening Status | X axis : Linux servers added into KHIKA Y Axis : stacked within each bar (server) the count of failed / passed events for various rules / policies |
| Policy wise status | X axis : Policy names Y axis : stacked with each bar (policy) count of failed or passed servers for that policy |
| Time trend | Trend of login events over time. Useful to identify unusual spikes at a glance. X axis : date & time Y axis : count of events |
| Summary Table | Detailed data with timestamp and count |
Some suggestions for useful interaction with this dashboard could be :
- Click on “Failed” in the “Contribution of Status” pie chart. The rest of the dashboard gets filtered and shows only Failed events. Enables having an easier look at the servers / policies which failed more often
- Click on a particular server in the bar “Server Wise Hardening Status”. Also click on the “Failed” in the above pie. This isolates the actionable inputs that you need to tune the server in question.
Linux Sudo Commands
Go to "Dashboards" from the left menu. From the list of in-built dashboards, select this one. It shall open the Dashboard. This report summarizes which sudo commands were fired by whom, and from which host. The sudo commands and super user details.
You can filter and search information and create new ones too. For help with Dashboards, click here
Elements in the Dashboard are explained below :
| Visualization | Description |
| Contribution of Users pie | Names and contribution of the Super users according to the commands they have fired |
| Contribution of Commands | Names and contribution of commands which were fired |
| Contribution of Path | The path names used |
| Hostname wise User | X axis : all the hostnames from where users have logged into the Linux server(s) Y axis : Usernames and count of events |
| Time trend | Trend of login events over time. Useful to identify unusual spikes at a glance. X axis : date & time Y axis : count of events |
| Summary Table | Detailed data with timestamp and count |
Some suggestions for useful interaction with this dashboard could be :
- Click on a particular username in the “Contribution of Users” pie. You can monitor all the activities of this super user.
- Alternately, click on a particular hostname from the bar graph “Hostname wise User” to check all the Super users logging into and firing commands on this host.
Linux User Activity Dashboard
Go to "Dashboards" from the left menu. From the list of in-built dashboards, select this one. It shall open the Dashboard. This report focusses on the user activity on Linux servers. Which actions users have taken, programs used etc. Names and contribution of commands which were fired.
You can filter and search information and create new ones too. For help with Dashboards, click here
Elements in the Dashboard are explained below :
| Visualization | Description |
| Contribution of Users pie | Names and contribution of the users according to the activities / events |
| Contribution of Programs pie | Names and contribution of commands / actions which were fired |
| Activities on Group bar graph | X axis : Activities carried out Y axis : Stacked within each bar (ie. for each activity) the group names and count of events |
| Time trend | Trend of login events over time. Useful to identify unusual spikes at a glance. X axis : date & time Y axis : count of events |
| Summary Table | Detailed data with timestamp and count |
Some suggestions for useful interaction with this dashboard could be :
- Drill down on the name of activity by clicking on any one bar on the “Activities on Group” – “new user” addition. Thus you can investigate how many new users were added on this group and other details about it can be seen in the summary table.
- Click on any sensitive program name from the pie “Contribution of Programs” and this will isolate the users, hostnames who executed it and their machine names.
Linux Root Check Details
Go to "Dashboards" from the left menu. From the list of in-built dashboards, select this one. It shall open the Dashboard. This report focusses on the access given to critical files. Details of who has access, who is the owner and the hostname etc. can be found.
You can filter and search information and create new ones too. For help with Dashboards, click here
Elements in the Dashboard are explained below :
| Visualization | Description |
| Contribution of Permissions | Names and contribution of the permissions given |
| Hostname wise Filename | X axis : Hostnames Y axis : Files stacked in one bar (host) and the count. |
| Time trend | Trend of login events over time. Useful to identify unusual spikes at a glance. X axis : date & time Y axis : count of events |
| Summary Table | Detailed data with timestamp and count |
A suggestion for useful interaction with this dashboard could be :
Click on and select a particular permission in the first pie. The rest of the dashboard reflects all the files and users with this permission.
Linux Alerts
Alerts are generated when certain ciritical behaviour is observed in the system – real time and notified on the Alerts Dashboard in KHIKA as well as can be received in email to relevant stakeholders. The details of KHIKA Alerts are mentioned here Click on “Alert Dashboard” on left menu.
Certain alerts for linux are pre-canned and shipped with KHIKA, keeping in mind the requirements of the users. They are mentioned in the table below :
Alerts Description
| Alert Name | Description | Suggested Resolution |
| Host's local firewall modified | This is triggered when atleast 2 modifications are done to IP tables rule, within one minute | Local firewall on the Linux server is updated. This could mean that the unwanted network traffic can now reach the server potentially compromising the security posture of the system. Check with system admin if this was done intentionally. If not, one must investigate further by : |
| Linux system in promiscuous mode | This alert is triggered when the event occurs such that a certain Linux system is in promiscuous mode | A promiscuous mode enables copying packets on a particular interface which may lead to sharing all the network information. Also, it may affect the performance of the server. Investigate if it is really required. |
| New user password not changed | New User Account created but Initial Password not changed within first 3 days | The generated password may be compromised during transit from admin to end-user if sent via insecure media like email. Authentication and Identification of the user is compromised and accountability of any bad actions cannot be accurately traced back. Force the user to change the password immediately. |
| Multiple syscall failures | Multiple events of syscall failure have occurred within two minutes | Typically, this indicates unauthorized attempts of accessing low level kernel resources. Check the binary/process responsible for this. Check the owner of the process (user). Investigate based on these two inputs. |
| Integrity changed for critical files | Alert triggered when any of the critical files in the Linux system being monitored are modified. ie- there is a change in the checksum value. | A change in a critical file can completely compromise the security posture of a linux system. It can also affect applications and cause outages. Such changes on a Linux system may indicate an attack or malicious intention or abuse of rights by a powerful user. Sometimes, it could be unintentional changes being applied by misconfigured software, such as patch management tools. Should be investigated whether these modifications were legitimate and done by authorized personnel. Check if proper change requests and approvals were in place. |
| Abnormal termination of process observed | Alert triggered when any abnormal termination of process occurs on Linux system | Typically, a process (binary executable) experienced a run time crash (SIGSEGV or equivalent). Check with the vendor of the executable. It may need a patch (could be a potential vulnerability). |
| Linux change in audit policy | Audit configuration has been modified on a Linux system | Someone (possible malicious user or an attacker) has changed the audit configuration of the system which may affect logging, partially or completely. Unless it is a legitimate change, this needs investigation. Check the last(or nearby) logon of the privileged users for further investigation. You can use "last" and "history" commands to get some clue. |
| Filesystem nearly full | Alert triggered when disk space on Linux system is more than 90 percent utilized. | Disk space utilization alert. Cleanup of disk is required. |
| Attempted Brute Force Attack | Alert triggered when atleast 20 minimum events of login failure occur within 5 minutes by the same user. | Possible attempt of a brute force attack where the attacker is trying to guess the username/password combination. Check the end node (IP address) from where these authentication attempts were fired.
If the IP address in question is external IP, cross validate with threat intelligence (You can use free IP reputation services such as IPVoid, VirusTotal etc.)Block the IP if the reputation found to be bad.
If the IP address in question is an internal IP, check the owner of the end node and verify who was the user in question. Investigate the reason and intentions for such login attempts. |
| Insecure SSH connection detected | Event of insecure SSH connection to a Linux system has occured | The user using weak cipher are susceptible for "man in the middle" attack where their credentials can be de-ciphered to compromise the account. Recommend an upgrade of SSH version on client side. Also, it is recommended to un-support weak SSH cipher on the server side so that the clients with weaker ciphers do not connect. |
| Successful Brute Force Attack | 5 failed login events one after the other followed by a successful login have occurred in this order within 30 minutes | This sequence of events indicates a successful brute force attack where multiple login failure events were a result of password guess attempts and the successful login followed by that, indicating a success guess of the password. Check with the affected user and disable the account if suspicion is raised. Further investigation may involve tracing the system from where these logins were made and trigger investigation on that system. Process tracking and investigating logs prior to successful logins may be useful. |
| Attempted Brute Force Attack | Atleast 10 login failure events by the same user on the same Linux host have occured within 5 minutes | An attacker is trying different combinations of username and passwords causing a few "login failure' messages within short time span. Many systems have users with popular names such as "root", "admin", "ubuntu", "ec2-user" etc. A popular username with a weak password is an easy entry for an attacker. It is recommended to disable users with popular names (such as root, ec2-user etc). Configure password-less authentication using ssh public-private key mechanism. Check from which IP address the authentication attempts are received. If the offending IP is from within the same network (internal IP), then trace the IP address and find the actual user attempting this. If the offending IP address is from the internet, find the reputation of the IP address using threat intelligence (one can use community based IP reputations such as VirusTotal, IPVoid etc). Block the IP at the firewall level. You can also update the IP Tables of the host under attack so that the offender IP is blocked |
| Fatal linux device error alert | Alert triggered when "Fatal" or "Critical" message from any Linux device is received | Fatal error reported at Linux device driver level. This needs immediate attention of the Linux administrator. This may result into complete server shutdown and may cause outage. |
| Attempted Brute force attack | Atleast 10 login failure events have occurred one after the other within a duration of 5 minutes | An attacker is trying different combinations of username and passwords causing a few "login failure' messages within short time span. Many systems have users with popular names such as "root", "admin", "ubuntu", "ec2-user" etc. A popular username with a weak password is an easy entry for an attacker. It is recommended to disable users with popular names (such as root, ec2-user etc) Configure password-less authentication using ssh public-private key mechanism. |
| User account created and deleted within short time span | Events of account created followed by deletion of the same has occurred within a time span of 60 minutes | The sequence of events, with a user getting created and then getting deleted within a short time span raises suspicion and must be investigated. Sometimes, an attacker, after compromising the system, creates a new user, performs the malicious activity and deletes the user after the intended work is done. Find the user who created the new user (check the logins and sudo logs near the time when the new user was created). Check if this activity was legitimate and required approvals were in place. |
| Concurrent multiple logins or password share / leak | More than one successful logins have occurred by the same user from different hosts within 5 minutes | There are very few legitimate reasons for the same user to be connected to a server from several different workstations. Same user suddenly logging into to multiple servers is suspicious and could mean a compromised account. Check with the affected user and disable the account if suspicion is raised. Further investigation may involve tracing the system from where these logins were made and trigger investigation on that system. Process tracking and investigating logs prior to successful logins may be useful. |
If you have Windows servers that, you must configure KHIKA App for Windows to monitor your Windows Servers.
