KHIKA App for Cisco Switch
Contents
- 1 Introduction
- 2 Enabling Syslog forwarding on the device
- 3 How to Install the KHIKA App for Cisco Switch?
- 4 How to get your Cisco Switch data into KHIKA ?
- 5 Adding the device in the Adaptor
- 6 Verifying SYSLOG data collection
- 7 How to check the output of Cisco Switch App ?
Introduction
Most of the network devices, such as firewalls, switches, routers, web proxies etc send the traffic and user activity related information in the form of logs over syslog protocol. Some applications such as Oracle database server, Symantec antivirus server, EMC SAN Storage etc also support syslog protocol as syslog is very efficient and simple to integrate with. KHIKA Data Aggregator is pre-configured with syslog services on port 514. The key parts to get here are :
- Enabling Syslog forwarding on the device
- Install the KHIKA App for Cisco Switch
- Get data from your Cisco Switch into KHIKA Aggregator
Enabling Syslog forwarding on the device
For help with enabling syslog forwarding on device click here
How to Install the KHIKA App for Cisco Switch?
It is assumed, that you have already configured KHIKA Data Aggregator in your environment. If not, please read how to configure KHIKA Data Aggregator and perform the pre-requisite steps.
This section explains how to pick and install the KHIKA application for Cisco Switch. Installing the application shall put together and activate the adapter (parser) that can handle Cisco Switch data format, the dashboards, and the alert rules preconfigured.
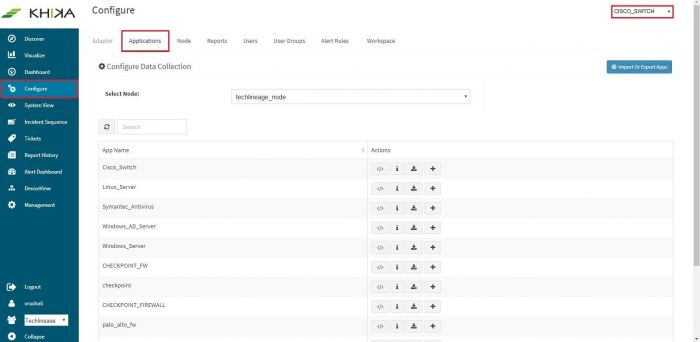
Go to the “Applications” tab in the “Configure” menu.
Check whether the appropriate Workspace is selected. Note: Application is always loaded in a Workspace. Read the section KHIKA Workspaces to know more about KHIKA Workspaces. Also select your KHIKA aggregator name in the Node dropdown. This is to ensure that we are collecting data from the desired source and into the correct workspace which is ready with the configured application and components.
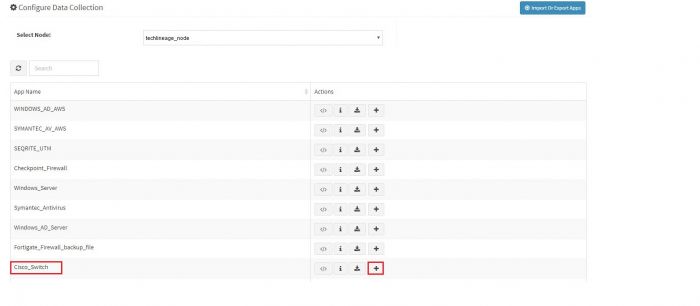
Click on the “+” button. A pop up appears.
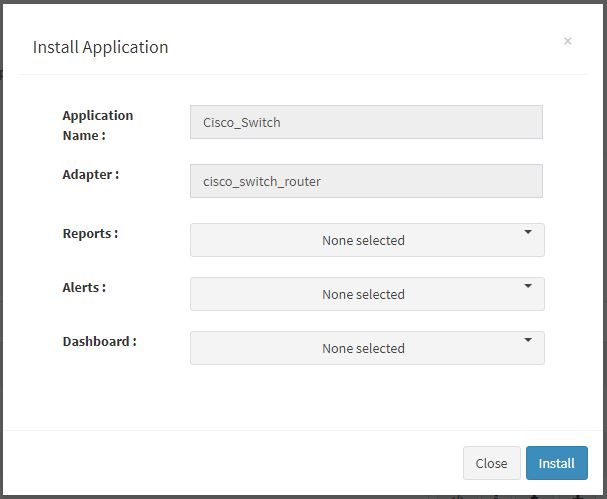
User can now select the contents of the application required. For example, on the dropdown for “Reports”, click to expand it. List of all reports can be seen. User can individually select the reports required by checking on the checkbox next to each. Alternatively, check on “Select All” option to get all of them. Similarly you can select contents from Alerts and Dashboards.
What are KHIKA Reports What are KHIKA Dashboards What are KHIKA Alerts
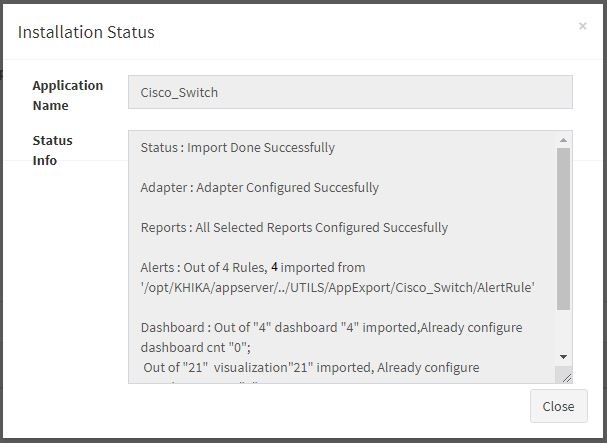
Click “OK” to proceed with the installation of the selected Application. After successful installation, following status should be displayed :
This simple procedure to install a KHIKA App, automatically configures the Adapter (required for parsing the data from raw syslogs), calculated KHIKA reports on raw data, Visualizations, Dashboards and Alerts – all in one click.
How to get your Cisco Switch data into KHIKA ?
KHIKA recommends, popular syslog forwarding to monitor the Cisco Switch. You must configure the network device (or the end node) to send its logs to KHIKA Data Aggregator by providing IP address of Data Aggregator and port 514 so that the device can send its logs to KHIKA syslog service. (Please refer the documentation of individual device/vendor/OEM to understand how to configure remote syslogging for the device. Many vendors support web based configuration these days and some vendors support command based configurations)
NOTE: You will have to repeat these steps on each of the APPLICATION that you wish to monitor using KHIKA.
Adding the device in the Adaptor
For help to adding a device in the adapter click here.
Verifying SYSLOG data collection
For help to verifying syslog data collection click here.
How to check the output of Cisco Switch App ?
Cisco Router Switch Link Status Dashboard
Go to "Dashboards" from the left menu. From the list of in-built dashboards, select this one. It shall open the Dashboard. This dashboard focuses on the Link status of Cisco Switch(which are added into KHIKA). Details like the link is Up or Down, available interfaces on the switch are shown in an analytical fashion. You can filter and search for information and create new ones too. For help with Dashboards, click here
Elements in the Dashboard are explained below :
| Visualization | Description |
| Contribution of Link Status | Contribution of Link Up/Down status of the switch |
| Contribution of Device IP | Contribution of Switches are available in the network |
| Interface wise Link Status | X axis : all the Interfaces which are present in Cisco switch Y axis : stacked in each bar (Status) status of link and count of events occurred. |
| Contribution of Facility and Severity | X axis : all the Facilities which are available in switch Y axis : stacked in each bar (Severity) Severity like information, error, notification, etc. and count of events occurred. |
| Time trend | Trend of events over time. Useful to identify unusual spikes at a glance. X axis : date & time Y axis : count of events |
| Summary Table | Detailed data with timestamp and count |
Suggestion for useful interaction with this dashboard could be :
- Click on Downstate from "Contribution of Link Status" pie chart. This gets selected and a filter for selected downstate is applied across the rest of the dashboard. The next pie chart shall show the switches which are in downstate.and in the next bar chart shall show Interfaces which are in the down state. Details of selected down status can be seen in the summary table. How to remove this filter is explained here
Cisco Switch Login Activity Dashboard
Go to "Dashboards" from the left menu. From the list of in-built dashboards, select this one. It shall open the Dashboard.This dashboard focuses on the login activity of users in Cisco Switch. Details like which user logged in how many times, login status, authentication information, Configuration changes, etc. is shown in an analytical fashion. You can filter and search for information and create new ones too. For help with Dashboards, click here
Elements in the Dashboard are explained below :
| Visualization | Description | ||
| Daily Trend | Trend of login events over time. Useful to identify unusual spikes at a glance. X axis : date & time Y axis : count of events | ||
| Contribution of Login Status pie chart | Contribution of success/failed status. | ||
| Contribution of Users pie chart | Contribution of Users which are logged in. | Source wise Local Port bar chart | X axis : Source IP where users are logged in Y axis : stacked in each bar (port) Local port and count of events occurred. |
| Daily Trend | Trend of login events over time. Useful to identify unusual spikes at a glance. X axis : date & time Y axis : count of events | ||
| Summary Table | Detailed data with timestamp and count |
A suggestion for useful interaction with this dashboard could be :
- Examine the time trend, for a higher number of events. Rest of the dashboard also gets filtered and we can isolate all the Users and status of executed action in a pie chart. In the next bar chart, we can isolate Source IP where users can log in and port which is used for logged in. Details of all activities in the selected time range can be seen in the summary table.
- Click on a particular user from "Contribution of Users" pie chart, Rest of the dashboard gets filtered and we can isolate login status, IP address of selected user port information which is used for logging and all the detailed information of the selected user in "Summary Table"
Severity Report Dashboard
Go to "Dashboards" from the left menu. From the list of in-built dashboards, select this one. It shall open the Dashboard. This dashboard focuses on the Severity of Events. Details like which Events is generated and what is the severity of that particular Event. Also, Message available in the event, Device IP, etc. are shown in an analytical fashion.
You can filter and search for information and create new ones too. For help with Dashboards, click here
Elements in the Dashboard are explained below :
| Visualization | Description |
| Events wise Messages | X axis : "Information" about generated events on switch Y axis : stacked in each bar (Messages)the message available in each event and count of events occurred. |
| Contribution of Severity pie chart | Contribution of Severity level like information, error, warning, etc. |
| Contribution of Facility and Severity | X axis : "Facility" available on switch Y Axis : stacked within each bar (Severity) the count of Severity for each specific facility on switch |
| Time trend | Trend of events over time. Useful to identify unusual spikes at a glance. X axis : date & time Y axis : count of events |
| Summary Table | Detailed data with timestamp and count |
Some suggestions for useful interaction with this dashboard could be :
- Click on "error" severity in the “Contribution of Severity” pie chart. The rest of the dashboard gets filtered and shows only detail information about selected "error" severity events. So we can isolate - Information of all the events which have error severity are available in Events wise Messages var chart.also in "Contribution of Facility and Severity" chart we can see various which facilities have an error severity.
System Information Report Dashboard
Go to "Dashboards" from the left menu. From the list of in-built dashboards, select this one. It shall open the Dashboard. This dashboard focused on System Information Report details. it shows changes in the configuration on the system , Severity of events and Device IP of switches available in the network, etc.
You can filter and search for information and create new ones too. For help with Dashboards, click here
Elements in the Dashboard are explained below :
| Visualization | Description |
| Contribution of System Activities pie chart | contribution of activities on the switch as configuration changed, login events, etc |
| Device IP wise Information | X axis : "Information" of event Y axis : Device IP of switch available in network.count of events occurred on the device. |
| Contribution of Severity | contribution of information/notification severity of event occurred. |
| Time trend | Trend of events over time. Useful to identify unusual spikes at a glance. X axis : date & time Y axis : count of events |
| Summary Table | Detailed data with timestamp and count |
Some suggestions for useful interaction with this dashboard could be :
- Click on a particular Device IP in the “Device IP wise Information” bar chart. You can monitor all the activities of this device, it isolates the severity level of the message and also configuration and logging information. Detailed information filtered for the selected device in "Summary Table"
Linux Alerts
Alerts are generated when certain critical behavior is observed in the system – real-time and notified on the Alerts Dashboard in KHIKA as well as can be received an email to relevant stakeholders. The details of KHIKA Alerts are mentioned here Click on “Alert Dashboard” on the left menu.
Certain alerts for Cisco Switch are pre-canned and shipped with KHIKA, keeping in mind the requirements of the users. They are mentioned in the table below :
Alerts Description
| Alert Name | Description | Suggested Resolution |
| Neighbor Down of a Switch | This alert is triggered when the event occurs such that a neighbor is in the down state. | This alert signifies that the neighbor relationship with the corresponding router/switch is down. This typically happens when Router/Switch does not receive keepalive/HELLO packets from the neighbor for a period of time longer than the Dead timer interval. If neighbor in the downstate, verify that the neighbor router is up, is running, and is properly configured for OSPF on the interface. You may refer the OEM Router/Switch manual for further information in this regard. |
| Command executed on switch | This alert is triggered when "cfglog_loggedcmd" message is available in the event. | Certain Commands have been executed on switch. You need to ensure that admin/configuration change commands are executed by authorized user only. |
| SLA Down on a Switch | This alert is triggered when the state changed Up to Down for SLA reachability | With Cisco IOS IP SLAs, service provider customers can measure and provide. service level agreements, and enterprise customers can verify service levels, verify outsourced service level agreements, and understand network performance. Cisco IOS IP SLAs can perform network assessments, verify quality of service (QoS), ease the deployment of new services, and assist with network troubleshooting. This alert denotes that network performance (as defined by SLAs) between multiple network locations or across multiple network paths is down/lower than expected SLAs. |
| Link down on switch | This alert is triggered when "changed state to down" message available in an event for particular switch device. | Link down on switch Admin may refer switch manual to take required action. |


