Difference between revisions of "KHIKA App for Windows"
(Created page with "Introduction Windows servers form an important part of organisations’ networks and hence by monitoring your windows servers you can keep a check, effectively troubleshoot an...") |
|||
| Line 18: | Line 18: | ||
Go to “Applications” tab in the “Configure” menu. | Go to “Applications” tab in the “Configure” menu. | ||
| − | Win1 | + | [[File:Win1.jpg|500px]] |
Check whether the appropriate Workspace is selected. | Check whether the appropriate Workspace is selected. | ||
| Line 24: | Line 24: | ||
Also select your KHIKA aggregator name in the Node dropdown. | Also select your KHIKA aggregator name in the Node dropdown. | ||
This is to ensure that we are collecting data from the desired source and into the correct workspace which is ready with the configured application and components. | This is to ensure that we are collecting data from the desired source and into the correct workspace which is ready with the configured application and components. | ||
| − | Win2 | + | |
| + | [[File:Win2.jpg|500px]] | ||
| + | |||
Click on the “+” button next to the Windows Server App. A pop up appears. | Click on the “+” button next to the Windows Server App. A pop up appears. | ||
| − | Win3 | + | |
| + | [[File:Win3.jpg|500px]] | ||
User can now select the contents of the application required. For example, on the dropdown for “Reports”, click to expand it. List of all reports can be seen. User can individually select the reports required by checking on the checkbox next to each. Alternatively, check on “Select All” option to get all of them. | User can now select the contents of the application required. For example, on the dropdown for “Reports”, click to expand it. List of all reports can be seen. User can individually select the reports required by checking on the checkbox next to each. Alternatively, check on “Select All” option to get all of them. | ||
| Line 36: | Line 39: | ||
Click “Install” to proceed with the installation of the selected Application. | Click “Install” to proceed with the installation of the selected Application. | ||
If you have created multiple windows workspaces in KHIKA, and installed Windows App previously, you will get below pop up. | If you have created multiple windows workspaces in KHIKA, and installed Windows App previously, you will get below pop up. | ||
| − | Win4 | + | |
| + | [[File:Win4.jpg|500px]] | ||
| + | |||
Click on OK to proceed. If this is not the case, ignore this step. | Click on OK to proceed. If this is not the case, ignore this step. | ||
After successful installation, following status should be displayed. | After successful installation, following status should be displayed. | ||
| − | Win5 | + | |
| + | [[File:Win5.jpg|500px]] | ||
| + | |||
Click on Close button. | Click on Close button. | ||
This simple procedure to install a KHIKA App, automatically configures the Adapter (required for parsing the data from raw syslogs), calculated KHIKA reports on raw data, Visualizations, Dashboards and Alerts – all in one click. | This simple procedure to install a KHIKA App, automatically configures the Adapter (required for parsing the data from raw syslogs), calculated KHIKA reports on raw data, Visualizations, Dashboards and Alerts – all in one click. | ||
| Line 60: | Line 67: | ||
Adding the device in the KHIKA | Adding the device in the KHIKA | ||
Go to Adapter tab, from the “Configure” menu. Click on the “Manage Devices” icon. | Go to Adapter tab, from the “Configure” menu. Click on the “Manage Devices” icon. | ||
| − | Win6 | + | |
| + | [[File:Win6.jpg|500px]] | ||
| + | |||
Pop up appears for device details | Pop up appears for device details | ||
| − | Win7 | + | |
| + | [[File:Win7.jpg|500px]] | ||
Click on “Add / Modify Device” tab. Another pop up appears for device details. | Click on “Add / Modify Device” tab. Another pop up appears for device details. | ||
| − | Win8 | + | [[File:Win8.jpg|500px]] |
Enter the expected device name. Also, in the field for IP address, enter “any”. | Enter the expected device name. Also, in the field for IP address, enter “any”. | ||
| Line 72: | Line 82: | ||
Select appropriate time zone of this device. In the “Node” field dropdown, select the name of the Aggregator or local data collector for this device. | Select appropriate time zone of this device. In the “Node” field dropdown, select the name of the Aggregator or local data collector for this device. | ||
Click on Submit. We get a success message and device is added successfully to this adaptor. | Click on Submit. We get a success message and device is added successfully to this adaptor. | ||
| − | Win9 | + | |
| + | [[File:Win9.jpg|500px]] | ||
Finally, go to Workspace tab and click on “Apply Configuration” icon. | Finally, go to Workspace tab and click on “Apply Configuration” icon. | ||
| − | Win10 | + | |
| + | [[File:Win10.jpg|500px]] | ||
We get a confirmation message here too, saying, “Changes Applied” | We get a confirmation message here too, saying, “Changes Applied” | ||
| Line 82: | Line 94: | ||
Now the expected Windows server is added in the relevant KHIKA Adapter or parser that will parse this data type. To see this device entry, click on “Manage Devices” icon next to the adaptor . | Now the expected Windows server is added in the relevant KHIKA Adapter or parser that will parse this data type. To see this device entry, click on “Manage Devices” icon next to the adaptor . | ||
| − | Win11 | + | [[File:Win11.jpg|500px]] |
| + | |||
A pop up with device details of the adaptor appears. Select “List of Devices” tab. | A pop up with device details of the adaptor appears. Select “List of Devices” tab. | ||
| − | Win12 | + | [[File:Win12.jpg|500px]] |
Click on the “Get OSSEC Key” icon next to this device. | Click on the “Get OSSEC Key” icon next to this device. | ||
| − | |||
| − | Win14 | + | [[File:Win13.jpg|500px]] |
| + | |||
| + | [[File:Win14.jpg|500px]] | ||
| + | |||
This is the unique key for this device created by the OSSEC server. Paste this key in the Ossec agent which is installed on this Windows server. | This is the unique key for this device created by the OSSEC server. Paste this key in the Ossec agent which is installed on this Windows server. | ||
Installing OSSEC Agent for Windows | Installing OSSEC Agent for Windows | ||
| Line 98: | Line 113: | ||
Select the installer file and Press "Run" | Select the installer file and Press "Run" | ||
| − | Win15 | + | [[File:Win15.jpg|500px]] |
Click Next | Click Next | ||
| − | Win16 | + | [[File:Win16.jpg|500px]] |
Select "I Agree" and proceed | Select "I Agree" and proceed | ||
| − | Win17 | + | [[File:Win17.jpg|500px]] |
Keep the default selection in the next window and click Next | Keep the default selection in the next window and click Next | ||
| − | Win18 | + | [[File:Win18.jpg|500px]] |
Enter the location to install the OSSEC agent on the local drive and let the installation complete | Enter the location to install the OSSEC agent on the local drive and let the installation complete | ||
| − | Win19 | + | |
| + | [[File:Win19.jpg|500px]] | ||
After the installation is complete, verify that the OSSEC HIDS Service is successfully installed on your Windows Server. (Go to your Service Control Panel and check for OSSEC HIDS Service) | After the installation is complete, verify that the OSSEC HIDS Service is successfully installed on your Windows Server. (Go to your Service Control Panel and check for OSSEC HIDS Service) | ||
| − | Win20 | + | |
| + | [[File:Win20.jpg|500px]] | ||
NOTE :- You will have to repeat these steps on all the Windows Servers that you wish to monitor using KHIKA. | NOTE :- You will have to repeat these steps on all the Windows Servers that you wish to monitor using KHIKA. | ||
| Line 125: | Line 142: | ||
In the OSSEC Agent installation directory, run win32ui.exe to open-up a window as shown below – Run as Administrator. | In the OSSEC Agent installation directory, run win32ui.exe to open-up a window as shown below – Run as Administrator. | ||
| − | Win21 | + | [[File:Win21.jpg|500px]] |
In the field “OSSEC Server IP” - Enter the IP Address of the KHIKA data aggregator or collector node and paste the copied key (generated by OSSEC server above) in the box against "Authentication key" and click Save. | In the field “OSSEC Server IP” - Enter the IP Address of the KHIKA data aggregator or collector node and paste the copied key (generated by OSSEC server above) in the box against "Authentication key" and click Save. | ||
From "Manage" drop-down, select "Restart" to restart the OSSEC Agent. Click on the Refresh button in the bottom next to Save. | From "Manage" drop-down, select "Restart" to restart the OSSEC Agent. Click on the Refresh button in the bottom next to Save. | ||
| − | Win22 | + | |
| + | [[File:Win22.jpg|500px]] | ||
| + | |||
Wait for a few minutes. Repeat above steps for all the agents to be added. | Wait for a few minutes. Repeat above steps for all the agents to be added. | ||
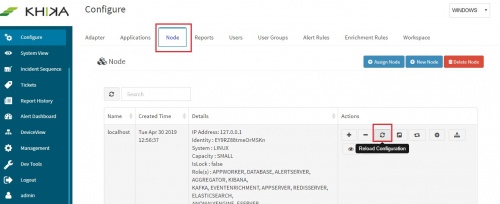
Reload Configuration | Reload Configuration | ||
Login into the KHIKA portal. | Login into the KHIKA portal. | ||
Go to Configure Select workspace, eg. WINDOWS_SERVERS Go to Node Tab Click Reload Config | Go to Configure Select workspace, eg. WINDOWS_SERVERS Go to Node Tab Click Reload Config | ||
| − | Win23 | + | |
| + | [[File:Win23.jpg|500px]] | ||
This step restarts OSSEC Server. | This step restarts OSSEC Server. | ||
| Line 143: | Line 163: | ||
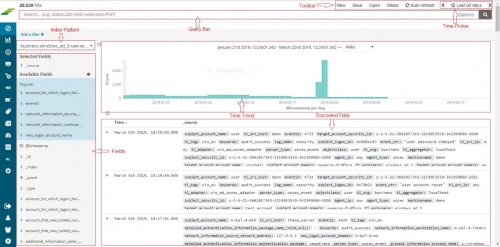
Once the device is added successfully, we can check the data for this device on Discover screen. Go to “Discover” from the main menu. | Once the device is added successfully, we can check the data for this device on Discover screen. Go to “Discover” from the main menu. | ||
Select the appropriate index for the same. Raw (khika formatted) data of all your Windows servers added is seen here. | Select the appropriate index for the same. Raw (khika formatted) data of all your Windows servers added is seen here. | ||
| − | Win24 | + | |
| + | [[File:Win24.jpg|500px]] | ||
To see the data for our newly added device, enter search string in lower case – | To see the data for our newly added device, enter search string in lower case – | ||
Revision as of 07:47, 30 May 2019
Introduction Windows servers form an important part of organisations’ networks and hence by monitoring your windows servers you can keep a check, effectively troubleshoot and be in control of your server metrics and statistics. KHIKA makes it further more simpler and faster by providing the monitoring effort and resources over AWS, so that you can focus on detecting and preventing risks with critical alerting feature, and gain insights with actionable dashboards.
With KHIKA App for Windows servers, you can :
• Monitor gigabytes of data generated every hour to identify live attack vectors such as brute force attempts, weak ssh ciphers, communication with bad IPs and many others. • Monitor access to and activities on your critical server assets • Use Actionable dashboards showing gaps in secured configuration and hardening of the severs • Do File integrity monitoring
We explain below steps to configure and interpret the output of KHIKA App for Windows Server. The key parts to get here are: 1. Install the KHIKA App for Windows 2. Get data from your Windows Server into KHIKA Aggregator
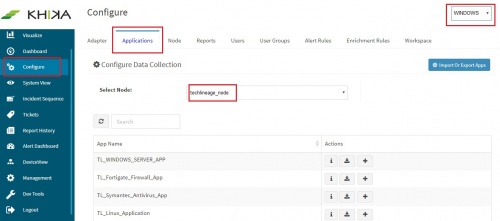
1. How to Install the KHIKA App for Windows? The section assumes that you have already configured KHIKA Data Aggregator in your environment. If not, please read “How to configure KHIKA Data Aggregator” and perform the pre-requisite steps. This section explains how to pick and install the KHIKA application for Windows Servers. Installing the application shall put together and activate the adapter (parser) that can handle Windows data format, the dashboards and the alert rules preconfigured. Go to “Applications” tab in the “Configure” menu.
Check whether the appropriate Workspace is selected. Note: Application is always loaded in a Workspace. Read the section on Workspaces to know more about KHIKA Workspaces. Also select your KHIKA aggregator name in the Node dropdown. This is to ensure that we are collecting data from the desired source and into the correct workspace which is ready with the configured application and components.
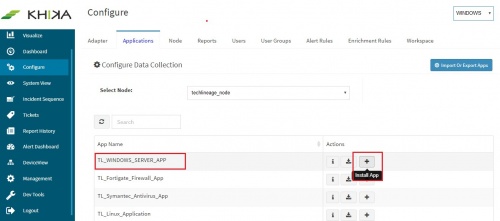
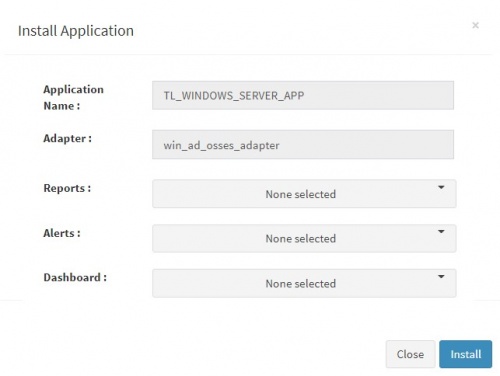
Click on the “+” button next to the Windows Server App. A pop up appears.
User can now select the contents of the application required. For example, on the dropdown for “Reports”, click to expand it. List of all reports can be seen. User can individually select the reports required by checking on the checkbox next to each. Alternatively, check on “Select All” option to get all of them. Similarly you can select contents from Alerts and Dashboards. What are KHIKA Reports What are KHIKA Dashboards What are KHIKA Alerts
Click “Install” to proceed with the installation of the selected Application. If you have created multiple windows workspaces in KHIKA, and installed Windows App previously, you will get below pop up.
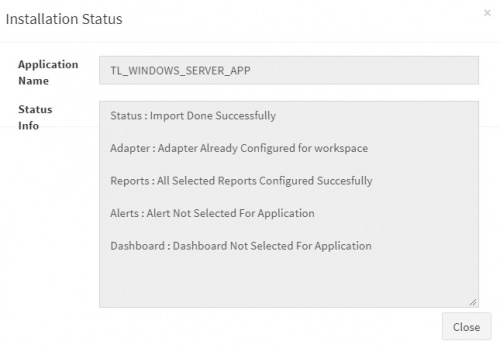
Click on OK to proceed. If this is not the case, ignore this step. After successful installation, following status should be displayed.
Click on Close button. This simple procedure to install a KHIKA App, automatically configures the Adapter (required for parsing the data from raw syslogs), calculated KHIKA reports on raw data, Visualizations, Dashboards and Alerts – all in one click.
2. How to get your Windows data into KHIKA ? KHIKA recommends, popular open source OSSEC integration to monitor the Windows servers. There are 2 components in OSSEC Integration with KHIKA. OSSEC Agent – Installed on each Windows server which we wish to monitor OSSEC Server – Present on KHIKA Data Aggregator (which you have installed before) The OSSEC agent and server communicate with each other using a unique key for encryption. The main steps to start getting data from a Windows server are Add the Windows server details in KHIKA Extract a unique key for this device from KHIKA Installing Ossec Agent on Windows Server Insert this key in the Ossec agent (ie. on your Windows server to be monitored) Reload Configuration in KHIKA Verify data collection in KHIKA Each of this can be a hyperlink to below sections. Each of these steps is explained in detail in the further sections.
Adding the device in the KHIKA
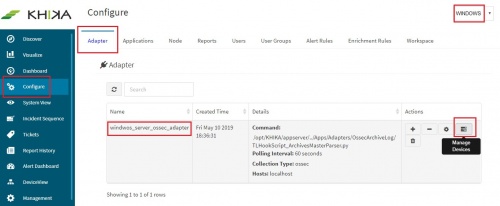
Go to Adapter tab, from the “Configure” menu. Click on the “Manage Devices” icon.
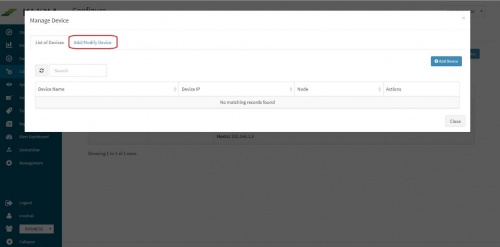
Pop up appears for device details
Click on “Add / Modify Device” tab. Another pop up appears for device details.
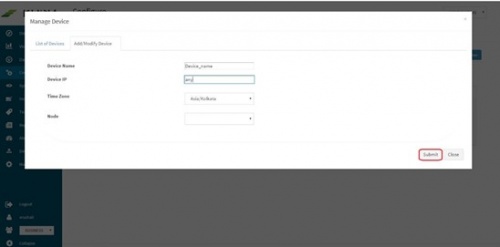
Enter the expected device name. Also, in the field for IP address, enter “any”. Please note : Always enter the IP Address as “any”. This is a safe and sure option to establish a connection with the server where we are suggesting ossec agent to use “any” of its configured IPs to be used to connect with the OSSEC Server. The device may have multiple NIC cards/IP addresses and unless we are sure of what IP will be used for connection, the connect will fail. Hence, use “any” Select appropriate time zone of this device. In the “Node” field dropdown, select the name of the Aggregator or local data collector for this device. Click on Submit. We get a success message and device is added successfully to this adaptor.
Finally, go to Workspace tab and click on “Apply Configuration” icon.
We get a confirmation message here too, saying, “Changes Applied”
Extract key from KHIKA OSSEC Server Now the expected Windows server is added in the relevant KHIKA Adapter or parser that will parse this data type. To see this device entry, click on “Manage Devices” icon next to the adaptor .
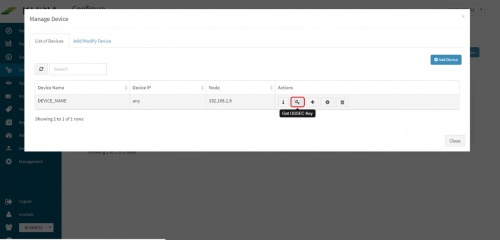
A pop up with device details of the adaptor appears. Select “List of Devices” tab.
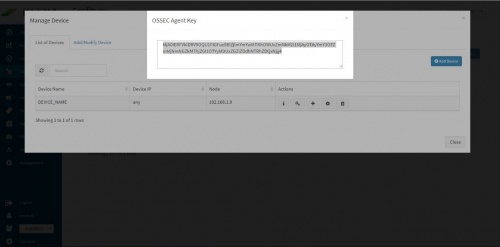
Click on the “Get OSSEC Key” icon next to this device.
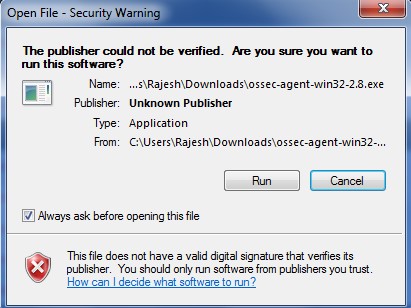
This is the unique key for this device created by the OSSEC server. Paste this key in the Ossec agent which is installed on this Windows server. Installing OSSEC Agent for Windows Download OSSEC agent for Microsoft Windows from KHIKA install directory. The agent is shipped with KHIKA installer and is located on KHIKA Server in /opt/KHIKA/UTILS/OSSEC directory. For Windows you will need to select the Windows installer with filename ossec-win32-agent.zip. This works for both 32-bit and 64-bit windows servers OS versions. Copy the downloaded installer on your Windows server (using winscp or your favourite scp client) and run installer with local "Admin" on the Server. Please Note : It is extremely important to install the OSSEC agent with admin privileges as this agent reads the security logs and in order to read it successfully, it has to be the local Admin. Select the installer file and Press "Run"
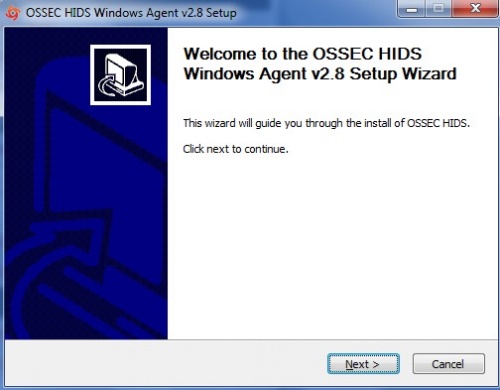
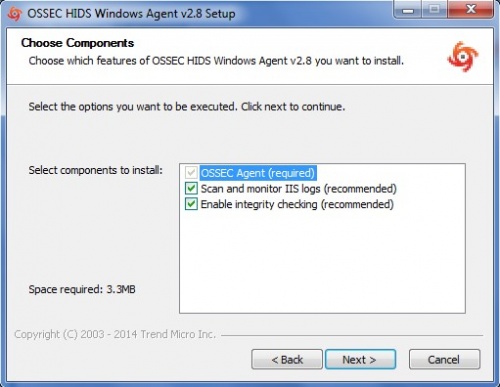
Click Next
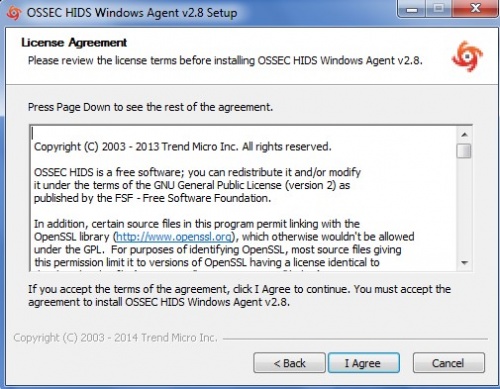
Select "I Agree" and proceed
Keep the default selection in the next window and click Next
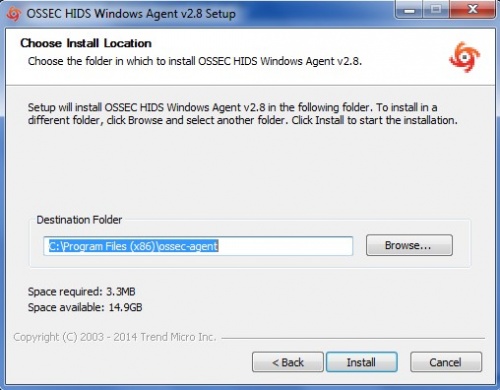
Enter the location to install the OSSEC agent on the local drive and let the installation complete
After the installation is complete, verify that the OSSEC HIDS Service is successfully installed on your Windows Server. (Go to your Service Control Panel and check for OSSEC HIDS Service)
NOTE :- You will have to repeat these steps on all the Windows Servers that you wish to monitor using KHIKA.
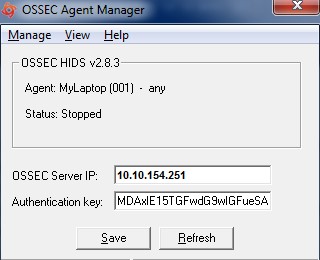
Insert unique OSSEC key in Windows OSSEC Agent Perform following simple steps on the Windows Agent In the OSSEC Agent installation directory, run win32ui.exe to open-up a window as shown below – Run as Administrator.
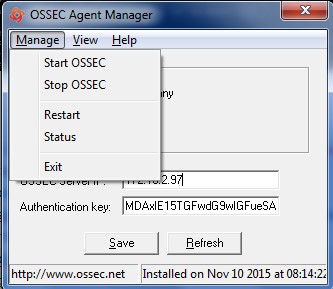
In the field “OSSEC Server IP” - Enter the IP Address of the KHIKA data aggregator or collector node and paste the copied key (generated by OSSEC server above) in the box against "Authentication key" and click Save. From "Manage" drop-down, select "Restart" to restart the OSSEC Agent. Click on the Refresh button in the bottom next to Save.
Wait for a few minutes. Repeat above steps for all the agents to be added. Reload Configuration Login into the KHIKA portal. Go to Configure Select workspace, eg. WINDOWS_SERVERS Go to Node Tab Click Reload Config
This step restarts OSSEC Server. Wait for a few minutes for server to restart.
Verifying OSSEC data collection
Once the device is added successfully, we can check the data for this device on Discover screen. Go to “Discover” from the main menu. Select the appropriate index for the same. Raw (khika formatted) data of all your Windows servers added is seen here.
To see the data for our newly added device, enter search string in lower case – tl_src_host : name_of_the_device_added_in_lower_case and click on the search icon.
3. How to check the output of KHIKA Windows App ?
Dashboards
Locked accounts Report An account getting locked could be due to unwarranted attempts to guess someone else’s password. This dashboards pinpoints the users and machines where accounts locked events occurred. Unusual incidents are easier to identify and analyse in the KHIKA dashboard. Elements in the Dashboard are explained below : Visualization Description User wise machine name bar graph X axis : Usernames Y axis : One or more machine names from where this user got locked out while trying to log into Windows Server and count of such events Machine name wise locked user pie Multi level pie chart. Inner level is the contribution of machine names. For any selected machine here, outer level shows all the users who tried to login and got locked out for this. Time trend Trend of login events over time. Useful to identify unusual spikes at a glance.
X axis : date & time Y axis : count of events Summary Table Detailed data with timestamp and count
Multiple Terminal login
Same user connected from multiple workstations doesn’t happen under usual circumstances. Hence this report helps regular monitoring of such incidents. It has details like which user logged in from which workstation how many times. This makes it easier to isolate events at the user or workstation level and see the metrics.
Elements in the Dashboard are explained below :
Visualization Description
Contribution of users pie This pie chart shows all the usernames occupying space according to the number of times they were logged in concurrently from multiple devices.
User wise login count X axis : Names of users
Y axis : count of such events for each user
Summary Table Detailed data with timestamp and count
Host wise Logon report This dashboard monitors machines for access. ie. login activities of users on different servers. Who logged in and from which host. Elements in the Dashboard are explained below : Visualization Description Contribution of servers pie Contribution of servers, according to logon events occurred. Contribution of users pie Contribution of usernames according to logon events occurred. Server wise passed failed login count X axis : Server names Y axis : Count of login failures and successes on each server Time trend Trend of login events over time. Useful to identify unusual spikes at a glance.
X axis : date & time Y axis : count of events Summary Table Detailed data with timestamp and count
Local logon failures
This dashboard shows a summary of logon failures, the host from which logon attempts were made to the windows server which we are monitoring, IP addresses, logon type, process details, domain details, reasons for failure etc.
This information gives helpful insights into user activity.
Elements in the Dashboard are explained below :
Visualization Description
Contribution of Servers pie Contribution of machine names according to the number of logon failure events.
Contribution of Users pie Contribution of user names according to the number of logon failure events
Contribution of Domains pie Contribution of domain names.
Contribution of Logon type pie Contribution of Logon type
Workstation wise remarks bar graph X axis : workstation names
Y axis : the count of logon failure events and remarks for each.
Time trend Trend of login events over time. Useful to identify unusual spikes at a glance.
X axis : date & time Y axis : count of events Summary Table Detailed data with timestamp and count
Windows Server Hardening
Server Hardening is the process of enhancing server security through a variety of means which results in a more secure server operating environment. This is due to the advanced security measures that are put in place during the server hardening process. KHIKA checks each server against out-of-box server hardening policies to ensure your servers are securely configured. It helps you to pinpoint and tune the exact details on hosts for better security posture.
The server hardening policies against which the servers are checked can be seen here.
Elements in the Dashboard are explained below :
Visualization Description
Contribution of status pie chart Failed or Passed compliance status
Server wise Hardening Status X axis : Windows servers added into KHIKA
Y Axis : stacked within each bar (server) the count of failed / passed events for various rules / policies
Policy wise status X axis : Policy names
Y axis : stacked with each bar (policy) count of failed or passed servers for that policy
Time trend Trend of login events over time. Useful to identify unusual spikes at a glance.
X axis : date & time Y axis : count of events Summary Table Detailed data with timestamp and count
Some suggestions for useful interaction with this dashboard could be : 1. Click on “Failed” in the “Contribution of Status” pie chart. The rest of the dashboard gets filtered and shows only Failed events. Enables having an easier look at the servers / policies which failed more often 2. Click on a particular server in the bar “Server Wise Hardening Status”. Also click on the “Failed” in the above pie. This isolates the actionable inputs that you need to tune the server in question.
Alerts Alerts are generated when certain ciritical behaviour is observed in the system – real time and notified on the Alerts Dashboard in KHIKA as well as can be received in email to relevant stakeholders. The details of KHIKA Alerts are mentioned here Click on “Alert Dashboard” on left menu. Certain alerts for Windows are pre-canned and shipped with KHIKA, keeping in mind the requirements of the users. They are mentioned in the table below :
