KHIKA App for Seqrite Utm Firewall
Contents
- 1 Introduction
- 2 Enabling Syslog forwarding on the device
- 3 Verifying SYSLOG data collection
- 4 How to Install the KHIKA App for Seqrite UTM Firewall ?
- 5 Adding the device in the Adaptor
- 6 How to check the output of KHIKA Seqrite UTM Firewall App ?
- 6.1 Discovering the logs of Seqrite UTM Firewall
- 6.2 SEQRITE UTM Bandwidth Usage Dashboard
- 6.3 SEQRITE UTM Intrusion Prevention Dashboard
- 6.4 SEQRITE UTM Malicious Communication Dashboard
- 6.5 SEQRITE UTM Policy Breach Attempts Dashboard
- 6.6 SEQRITE UTM Website Category Wise URL Access Dashboard
- 6.7 Seqrite UTM Firewall Alerts
Introduction
Firewalls form an important part of organisations’ networks and hence monitoring your firewall is imperative. Seqrite UTM Firewall sends the traffic and user activity related information in the form of logs over syslog protocol. KHIKA Data Aggregator is pre-configured with syslog services on port 514. The key parts to get here are :
- Enabling Syslog forwarding on the device.
- Install the KHIKA App for SEQRITE UTM Firewall.
- Get data from your SEQRITE UTM Firewall into KHIKA Aggregator.
Enabling Syslog forwarding on the device
Please refer to Fortigate Seqrite UTM Firewall documentation page no. 199 for enabling syslogs on your Seqrite UTM Firewall.
Example of Steps to forward Syslog to KHIKA Remote Syslog Server:
Adding a remote syslog server
1. Navigate to Logs and Reports > Settings > Remote Syslog Server.
2. Click the + icon to add a new Syslog server. The Add server dialog box is displayed.
3. Enter the name and IP address of the server.
4. Enter the port number and select the type of protocol using which the log files would be
sent to the Syslog server.
5. KHIKA Syslog Server typically listens on UDP 514 Port.Please use UDP protocol and 514 port for log forwarding.
Verifying SYSLOG data collection
After you enable the syslog forwarding on the end device, you must verify if the logs are being really received by KHIKA Data Aggregator. Please refer here to understand how to verify syslogs on KHIKA Data Aggregator.
How to Install the KHIKA App for Seqrite UTM Firewall ?
It is assumed, that you have already configured KHIKA Data Aggregator in your environment. If not, please read how to configure KHIKA Data Aggregator and perform the pre-requisite steps.
This section explains how to pick and install the KHIKA application for Seqrite UTM Firewall - Seqrite UTM Firewall. Installing the application shall put together and activate the adapter (parser) that can handle Checkpoint Firewall data format, the dashboards and the alert rules preconfigured.
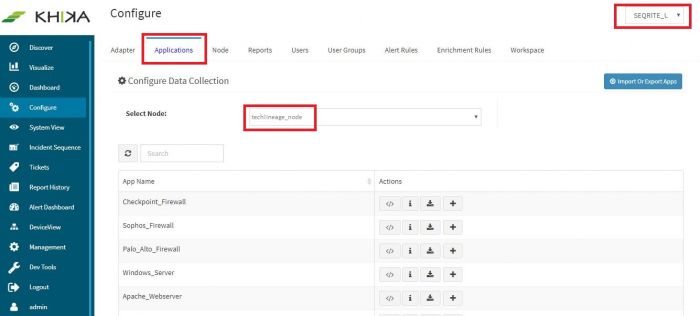
Go to “Applications” tab in the “Configure” menu.
Check whether the appropriate Workspace is selected. Note: Application is always loaded in a Workspace. Read the section on Workspaces to know more about KHIKA Workspaces. Also select your KHIKA aggregator name in the Node dropdown. This is to ensure that we are collecting data from the desired source and into the correct workspace which is ready with the configured application and components.
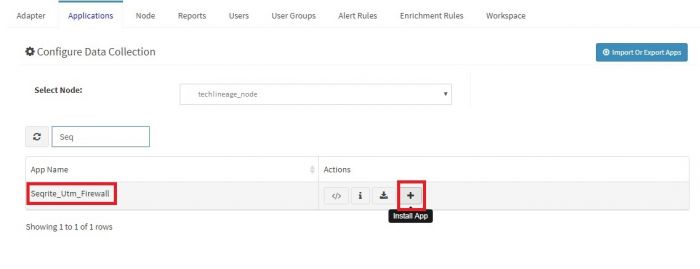
Click on the “+” button. A pop up appears.
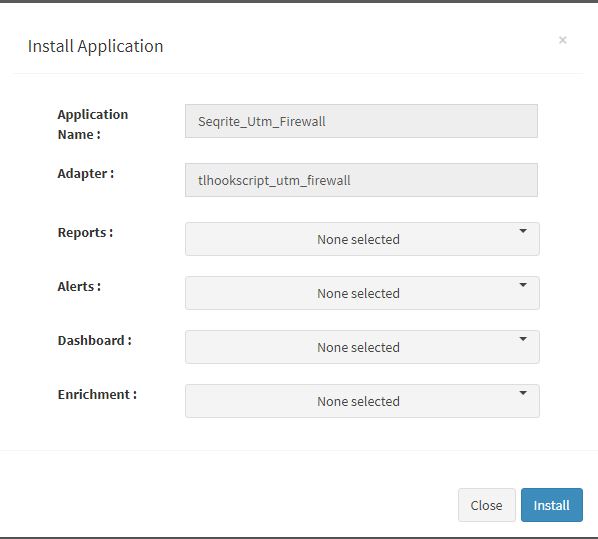
User can now select the contents of the application required. For example, on the dropdown for “Reports”, click to expand it. List of all reports can be seen. User can individually select the reports required by checking on the checkbox next to each. Alternatively, check on “Select All” option to get all of them. Similarly you can select contents from Alerts and Dashboards.
Visit the sections on KHIKA Reports, KHIKA Dashboards, KHIKA Alerts & Correlations to know more about these topics.
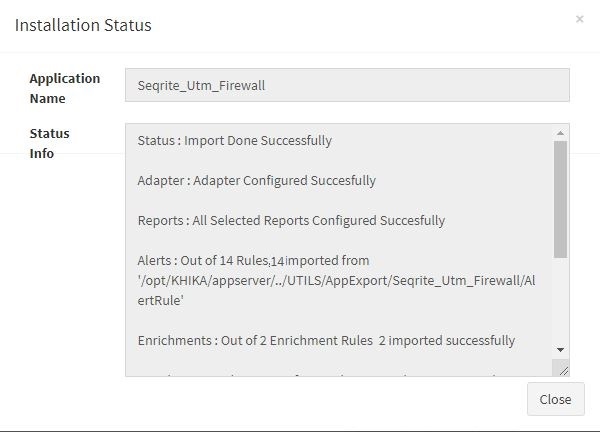
Click “OK” to proceed with the installation of the selected Application. After successful installation, following status should be displayed :
This simple procedure to install a KHIKA App, automatically configures the Adapter (required for parsing the data from raw syslogs), calculated KHIKA reports on raw data, Visualizations, Dashboards and Alerts – all in one click.
Adding the device in the Adaptor
After syslogs are enabled on the device and the App is installed into KHIKA, it is time to add the device to the App (in Adapter section of KHIKA Web GUI). Please refer here to know how to add the device to an App.
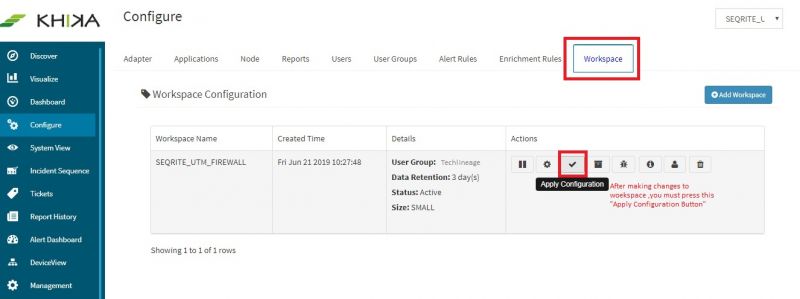
After the configuration changes in KHIKA, you must apply these changes to the Workspace. Go to Configure, select the Workspace and in Workspace tab of configure menu press the Apply button as shown in the screenshot below.
Wait for a few minutes for changes to apply and data to arrive in KHIKA. With all these steps, we should now expect the data to arrive in KHIKA. Lets discover some live data in KHIKA.
How to check the output of KHIKA Seqrite UTM Firewall App ?
Discovering the logs of Seqrite UTM Firewall
After doing all the steps given above, we should start receiving live data into KHIKA. Go to "Discover" section in KHIKA GUI and select the index with name "*raw-seqrite_utm_firewall*". Note that the index has a prefix of the customer name and workspace name. After selecting this index, you should see the live data coming in. Spend some time understanding this data and the fields of the data.
SEQRITE UTM Bandwidth Usage Dashboard
This Dashboard briefly explains the bandwidth consumption by user.
Elements in the Dashboard are explained below :
| Visualization | Description |
| Contribution of User | Contribution of top users present in the events. |
| User wise Max Total Usage | X axis : User(s) Y axis : Total usage by the user. |
| User IP Address wise Max Daily Download | X axis : User IP(s) Y axis : Max of Daily Download by the User IP. |
| User IP Address wise Max Daily Upload | X axis : User IP(s) Y axis : Max of Daily Upload by the user IP. |
| Daily trend | Trend of bandwidth events over time. Useful to identify unusual spikes at a glance. X axis : date & time Y axis : count of events |
| Summary Table | Detailed data with timestamp and count |
A suggestion for useful interaction with this dashboard could be :
- Click on "User" in Contribution of User donut chart.This selected change will be reflected in all the visualizations accordingly.In the "User wise Max Total Usage" visualization we can see maximum of Total Usage done by the user."User IP Address wise Max Daily Download" shall show user IP wise Max daily download which is related to the selected user.Detailed information can be seen in the detailed "Summary Table".
SEQRITE UTM Intrusion Prevention Dashboard
This dashboard shows summary of Intrusion Prevention.
Elements in the Dashboard are explained below :
| Visualization | Description |
| Contribution Of Intrusion Signature | Contribution of different Intrusion Signatures present in the events. |
| Contribution Of Destination IP | Contribution of different Destination IP(s) |
| Contribution Of Destination Port | Contribution of Destination Port(s) like on which port the communication took place. |
| Contribution Of Source IP | Contribution of Source IP(s) from where the communication initiated. |
| Daily trend | Trend of events related to Intrusion Prevention over time. Useful to identify unusual spikes at a glance. X axis : date & time Y axis : count of events |
| Summary Table | Detailed data with timestamp and count |
A suggestion for useful interaction with this dashboard could be :
- Click on Source IP from "Contribution Of Source IP".This selection will result into reflection of all the visualizations present in the dashboard accordingly.In "Contribution Of Destination IP" we can see the destination(s) in the communication with respect to the selected Source IP.Similarly, "Contribution Of Intrusion Signature" will display the Intrusion Signature for the selected fields captured in the events.Detailed information related to this dashboad can be seen in the Summary Table.
SEQRITE UTM Malicious Communication Dashboard
This dashboard shows brief summary of Malicious Communication happening in our network
Elements in the Dashboard are explained below :
| Visualization | Description |
| Contribution of Action | Contribution of Different Actions present in the Communication. |
| Contribution of Malicious IP | Contribution of Top Malicious IP(s) present in the communication. |
| Contribution of Source IP | Contribution of Top Source IP(s) present in the communication. |
| Contribution Of Destination IP | Contribution of Top Destination IP(s) present in the communications. |
| Daily trend | Trend of Malicious Communication related events over time. Useful to identify unusual spikes at a glance. X axis : date & time Y axis : count of events |
| Summary Table | Detailed data with timestamp and count |
A suggestion for useful interaction with this dashboard could be :
- Click on "Malicious IP" from Contribution of Malicious IP donut chart. This selection will reflect in all the visualizations accordingly.We can see action in the Contribution of Action visualization to check whether the connection was successfully established or not.To further drill down, We can check the source and destination IP(s) in the communication and check whether the connection was inbound or outbound.
Example : If Malicious IP and Source IP are same then we can say that the connection is inbound and if Malicious IP and Destination IP are same then we can say that the connection is outbound.
SEQRITE UTM Policy Breach Attempts Dashboard
This dashboard shows summary of policy breach attempts
Elements in the Dashboard are explained below :
| Visualization | Description |
| Contribution of User IP | Contribution of Top User IP(s) present in the events. |
| Category wise URL | X Axis : Different types of Categories. Y Axis : Category wise URL(s) |
| Contribution of User Name | Contribution of top User Names present in the events. |
| Contribution of User Group | Contribution of different User Groups present. |
| Daily trend | Trend of Policy Breach Attempt related events over time. Useful to identify unusual spikes at a glance. X axis : date & time Y axis : count of events |
| Summary Table | Detailed data with timestamp and count |
A suggestion for useful interaction with this dashboard could be :
- This dashboard can be used to check the attempts made by user which might be breaking the policies of the organization.Click on any User in Contribution Of User Name visualization.This selection will reflect accross all the visualizations accordingly.In category wise URL, we can check Category wise URL(s) visited by the user which are not allowed to be visited as per the policy. Similarly in Contribution IP we can see the IP used by the user.For detailed information related to the communication we can use Summary Table.
SEQRITE UTM Website Category Wise URL Access Dashboard
This dashboard shows distribution of websites accessed as per category
Elements in the Dashboard are explained below :
| Visualization | Description |
| Contribution of User | Top User(s) present in the events. |
| Contribution of IP Address | Top IP Address present in the events. |
| Category wise URL | X Axis : Types of Website Categories Y Axis : Category wise URL |
| Daily trend | Trend of events over time. Useful to identify unusual spikes at a glance. X axis : date & time Y axis : count of events |
| Summary Table | Detailed data with timestamp and count |
A suggestion for useful interaction with this dashboard could be :
- This dashboard can be used to gain the knowledge of URLs and Categories accessed by Users. Click on User or IP Address for deeper investigation. All the visualizations present in the dashboard will reflect accordingly. "Category wise URL" section will show the category and visited URLs in this category with respect to selected User/Source IP. For Detailed information we can use Summary Table.
Seqrite UTM Firewall Alerts
Alerts are generated when certain critical behavior is observed in the system. Alerts can be monitored in real-time on Alerts Dashboard in KHIKA. Relevant stakeholders can also receive the alerts via emails. The table below explains all the pre-canned alerts shipped with KHIKA App for Seqrite UTM Firewall.
Alerts Description
| Alert Name | Description | Suggested Resolution |
| Seqrite utm firewall sweep scan attack | This alert is triggered when same source ip is trying to generate traffic on more than 10 destination ip but all the time request is denied .All this happen within 1 minute. | An attacker tries to spray connection requests on one of the popular ports (21,22,53,80,443 etc) on multiple IP addresses with an intention to find which ports are opened on what IP addresses. Typically, scan attempt is the first stage of reconnaissance in the attack life cycle. Unless it is a known and legitimate IP address performing scan, it is important to block this IP. You may white-list the known IP addresses (such as designated Vulnerability Scanner, Asset Discovery Tools etc), so as to suppress the false positives. |
| Seqrite utm firewall host scan activity | This alert is triggered when same source ip is trying to generate traffic on same destination ip on more than 10 destination port but all the time request is denied .All this happen within 1 minute. | An attacker tries to spray connection requests on multiple popular ports (21,22,53,80,443 etc) targeting one single IP addresses at a time with an intention to find the open ports on the target IP address. Typically, scan attempt is the first stage of reconnaissance in the attack life cycle. Unless it is a known and legitimate IP address performing the scan, it is important to block this IP. You may white-list the known IP addresses (such as designated Vulnerability Scanner, Asset Discovery Tools etc), so as to suppress the false positives. |
| Seqrite utm firewall communication with possible ioc or bad ip | This alert is triggered when any one of the Source or Destination IP is found malicious with accepted action | KHIKA shares community based threat intelligence (TI) every 24 hours. TI has list of IP addresses with bad reputation. Every bad IP is marked with number of communities reporting it, name of each community and confidence indicating how confident are we about the reputation. This alert is generated when communication with a bad IP is let through. If communication with a bad IP is happening, it must be blocked immediately as it could be a possible attack or data exfiltration. You can check how log this communication is happening by simply searching the malicious IP in the logs. You can also check what internal IP addresses are communicating with this IP addresses and track the real users behind those internal IP addresses. Cross-check the reputation of the IP with popular websites such as ipvoid.com, virustotal.com If you see an internal IP constantly getting involved in malicious communication (with same or multiple external IP addresses), you may install agents on the internal nodes involved and check the real user and process responsible for this communication. It is critical to block this rogue communication. |
| Seqrite utm firewall seqrite backdoor activity | This alert is triggered when traffic is generated from internal machine on vulnerable ports(3127,3198,6129,7080). | This event indicates that a traffic is generated from internal machine on vulnerable ports(3127,3198,6129,7080). Typically, these ports are used by attacker to exploit vulnerable programs listening on these ports. Check is these ports are open and on what servers. Do you really need these ports opened? Check what programs are running on these ports. Check vulnerability reports of the applications Block these ports for external traffic, unless mandatory to keep them opened. If you have to keep any of these ports opened, try to restrict the access to legitimate IPs. If you get a suspicious IP repetitively trying to access these port, block the IP. Check the reputation of the IP on popular website such as ipvoid.com, virustotal.com etc. |
| Seqrite utm firewall host communicating with multiple malicious hosts within 1 hour | This alert is triggered when any one of the internal hosts is communicating with two or more external hosts with bad reputation. | KHIKA shares community based threat intelligence (TI) every 24 hours. TI has list of IP addresses with bad reputation. Every bad IP is marked with number of communities reporting it, name of each community and confidence indicating how confident are we about the reputation. This alert is generated when same internal ip communicates with multiple malicious IPs. If communication with a bad IP is happening, it must be blocked immediately as it could be a possible attack or data exfiltration. You can check how log this communication is happening by simply searching the malicious IP in the logs. You can also check what internal IP addresses are communicating with this IP addresses and track the real users behind those internal IP addresses. Cross-check the reputation of the IP with popular websites such as ipvoid.com, virustotal.com If you see an internal IP constantly getting involved in malicious communication (multiple external IP addresses), you may install agents on the internal nodes involved and check the real user and process responsible for this communication. It is critical to block this rogue communication. |
| Seqrite utm firewall policy breach attempts | This alert is triggered when there is a attempt of policy breach from internal hosts. | This event indicates that a traffic is generated from internal host which might violet the organization's policy.Category of the URLs visited by the user is present in the events.Depending on the category,Some firewall rules are predefined in the organization which states which categories should be accessible to the users/user groups. If you see any User/IP_address constantly communicating with the URL(s) with category which are not allowed as per the organization's policy,You may want to take appropriate action on the user or if required quarantine the host. |
| Seqrite utm firewall communication between multiple Internal hosts and single malicious ip | This alert is triggered when communication happens between two or more internal hosts and distinct external host with bad reputation. | KHIKA shares community based threat intelligence (TI) every 24 hours. TI has list of IP addresses with bad reputation. Every bad IP is marked with number of communities reporting it, name of each community and confidence indicating how confident are we about the reputation. This alert is generated communication happens between multiple internal hosts and same external malicious ip. If communication with a bad IP is happening, it must be blocked immediately as it could be a possible attack or data exfiltration. You can check how log this communication is happening by simply searching the malicious IP in the logs. You can also check what internal IP addresses are communicating with this IP addresses and track the real users behind those internal IP addresses. Cross-check the reputation of the IP with popular websites such as ipvoid.com, virustotal.com If you see an internal IP constantly getting involved in malicious communication (with same external IP address), you may install agents on the internal nodes involved and check the real user and process responsible for this communication. It is critical to block this rogue communication. |
| Seqrite utm firewall communication with suspicious ip | This alert is triggered when bytes are sent and received during communication with malicious ip within 1 minute. | Communication with a bad IP is happening, it must be blocked immediately as it could be a possible attack or data exfiltration.
You can check the log for this communication by simply searching the malicious IP in the logs. You can also check which internal IP addresses are communicating with this IP address and track the real users behind those internal IP addresses. |
| Seqrite utm firewall host scan activity by malicious ip | This alert is triggered when same malicious ip is trying to generate traffic for one destination ip on more than 10 different ports within 1 minute and the request is denied. | Bad ip address tries to spray connection requests on multiple popular ports (21,22,53,80,443 etc) targeting one single IP address at a time with an intention to find the open ports on the target IP address. Typically, scan attempt is the first stage of reconnaissance in the attack life cycle. It is important to check the reputation of the external ip address and block the same if necessary. |
| Seqrite utm firewall successful host scan activity by malicious ip | This alert is triggered when same malicious ip is trying to generate traffic for one destination ip on more than 10 different ports, but all the time request is denied .After that same malicious ip attempt to connect to same destination ip on one more port and this time it successfully connected on that port. All this happen within 1 minute. | Bad ip address tries to spray connection requests on multiple popular ports (21,22,53,80,443 etc) targeting one single IP addresses at a time with an intention to find the open ports on the target IP address. Typically, scan attempt is the first stage of reconnaissance in the attack life cycle and attacker done successful connection on open ports. It is important to check the reputation of the external ip address and block the same if necessary. It is also important to verify the sanity of affected internal nodes by checking if any unwarranted system policy change or software configuration/updates have occurred during the affected time period. If required, quarantine the affected servers till the time the issues are resolved. |
| Seqrite utm firewall sweep scan attack by malicious ip | This alert is triggered when same malicious ip is trying to generate traffic on more than 10 destination ip but all the time request is denied . All this happens within 1 minute. | Bad ip addresses tries to spray connection requests on one of the popular ports (21,22,53,80,443 etc) on multiple IP addresses with an intention to find which ports are opened on what IP addresses. Typically, scan attempt is the first stage of reconnaissance in the attack life cycle. It is important to check the reputation of the external ip address and block the same if necessary. |
| Seqrite utm firewall successful sweep scan activity by malicious ip | This alert is triggered when same malicious ip is trying to generate traffic on more than 10 destination ip but all the time request is denied .After that same source ip attempts to connect to one more destination ip and this time it successfully connects. All this happen within 1 minute. | Bad ip address tries to spray connection requests on one of the popular ports (21,22,53,80,443 etc) on multiple IP addresses with an intention to find which ports are opened on what IP addresses. Typically, scan attempt is the first stage of reconnaissance in the attack life cycle and attacker finds open port on one of ip addresses and is able to establish a connection. It is important to check the reputation of the external ip address and block the same if necessary. It is also important to verify the sanity of affected internal nodes by checking if any unwarranted system policy change or software configuration/updates have occured during the affected time period. If required, quarantine the affected servers till the time the issues are resolved. |
| Seqrite utm firewall successful sweep scan activity | This alert is triggered when same source ip is trying to generate traffic on more than 10 destination ip but all the time request is denied .After that same source ip attempts to connect one more destination ip and this time it successfully connects. All this happen within 1 minute. | Attacker tries to spray connection requests on one of the popular ports (21,22,53,80,443 etc) on multiple IP addresses with an intention to find which ports are opened on what IP addresses. Typically, scan attempt is the first stage of reconnaissance in the attack life cycle and attacker done successful connection on one of ip addresses It is important to check the reputation of the suspected ip address. If the suspected ip address is external, you may consider blocking it. If the suspected ip address is internal, you may need to verify the sanity of the corresponding device It is also important to verify the sanity of affected internal nodes by checking if any unwarranted system policy change or software configuration/updates have occured during the affected time period. If required, quarantine the affected servers till the time the issues are resolved. This may be a false positve.
|
