KHIKA App for Checkpoint Firewall
Contents
- 1 Introduction
- 2 Enabling Syslog forwarding on the device
- 3 How to Install the KHIKA App for Checkpoint Firewall ?
- 4 How to get your Checkpoint Firewall into KHIKA ?
- 5 Adding the device in the Adaptor
- 6 Verifying SYSLOG data collection
- 7 How to check the output of KHIKA Checkpoint Firewall App ?
- 7.1 Chekpoint Firewall Malicious Communication Dashboard
- 7.2 Chekpoint Firewall Triggered Signature Dashboard
- 7.3 Chekpoint Firewall VPN Activity Dashboard
- 7.4 Chekpoint Firewall Attack Dashboard
- 7.5 Chekpoint Firewall Audit Admin login Dashboard
- 7.6 Chekpoint Firewall Allowed External Source Dashboard
- 7.7 Chekpoint Firewall Blocked External Source Dashboard
- 7.8 Chekpoint Firewall Object Manipulation Dashboard
- 7.9 Chekpoint Firewall Alerts
Introduction
Most of the network devices, such as firewalls, switches, routers, web proxies etc send the traffic and user activity related information in the form of logs over syslog protocol. Some applications such as Oracle database server, Symantec antivirus server, EMC SAN Storage etc also support syslog protocol these days as syslog is very efficient and simple to integrate with. KHIKA Data Aggregator is pre-configured with syslog services on port 514. The key parts to get here are :
- Enabling Syslog forwarding on the device
- Install the KHIKA App for Checkpoint Firewall
- Get data from your into KHIKA Aggregator
Enabling Syslog forwarding on the device
You must configure the network device (or the end node) to send its logs to KHIKA Data Aggregator by providing IP address of Data Aggregator and port 514 so that the device can send its logs to KHIKA syslog service. (Please refer the documentation of individual device/vendor/OEM to understand how to configure remote syslogging for the device. Many vendors support web based configuration these days and some vendors support command based configurations)
How to Install the KHIKA App for Checkpoint Firewall ?
It is assumed, that you have already configured KHIKA Data Aggregator in your environment. If not, please read how to configure KHIKA Data Aggregator and perform the pre-requisite steps.
This section explains how to pick and install the KHIKA application for Checkpoint Firewall . Installing the application shall put together and activate the adapter (parser) that can handle Checkpoint Firewall data format, the dashboards and the alert rules preconfigured.
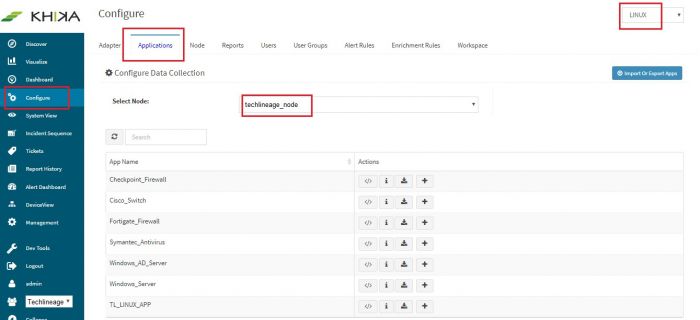
Go to “Applications” tab in the “Configure” menu.
Check whether the appropriate Workspace is selected. Note: Application is always loaded in a Workspace. Read the section on Workspaces to know more about KHIKA Workspaces. Also select your KHIKA aggregator name in the Node drop-down. This is to ensure that we are collecting data from the desired source and into the correct workspace which is ready with the configured application and components.
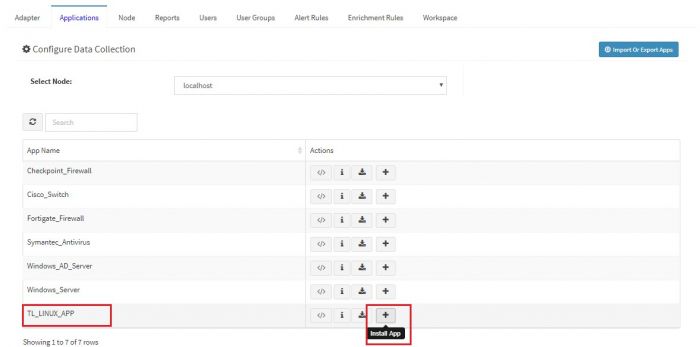
Click on the “+” button. A pop up appears.
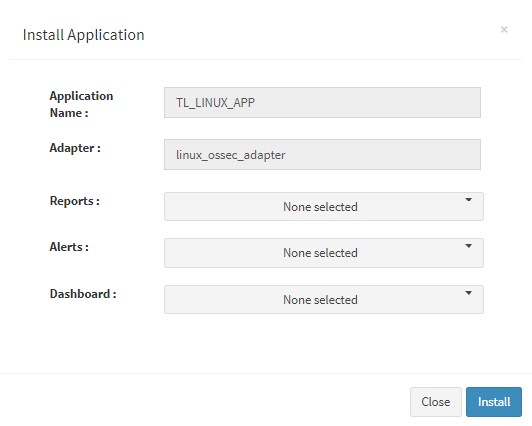
User can now select the contents of the application required. For example, on the dropdown for “Reports”, click to expand it. List of all reports can be seen. User can individually select the reports required by checking on the checkbox next to each. Alternatively, check on “Select All” option to get all of them. Similarly you can select contents from Alerts and Dashboards.
What are KHIKA Reports What are KHIKA Dashboards What are KHIKA Alerts
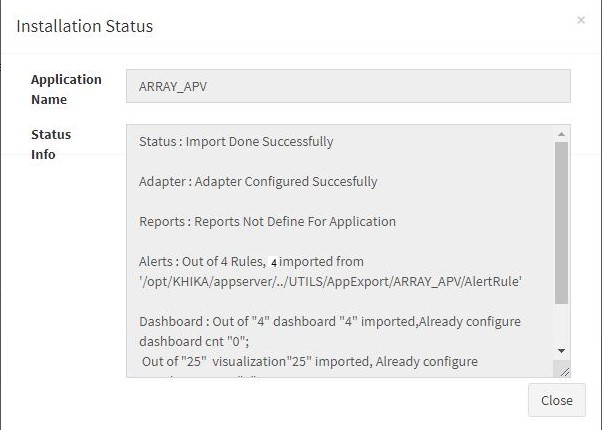
Click “OK” to proceed with the installation of the selected Application. After successful installation, following status should be displayed :
This simple procedure to install a KHIKA App, automatically configures the Adapter (required for parsing the data from raw syslogs), calculated KHIKA reports on raw data, Visualizations, Dashboards and Alerts – all in one click.
How to get your Checkpoint Firewall into KHIKA ?
KHIKA recommends, popular syslog forwarding to monitor the Checkpoint Firewall. You must configure the network device (or the end node) to send its logs to KHIKA Data Aggregator by providing IP address of Data Aggregator and port 514 so that the device can send its logs to KHIKA syslog service. (Please refer the documentation of individual device/vendor/OEM to understand how to configure remote syslogging for the device. Many vendors support web based configuration these days and some vendors support command based configurations)
NOTE: You will have to repeat these steps on each of the <APPLICATION NAME> that you wish to monitor using KHIKA.
Adding the device in the Adaptor
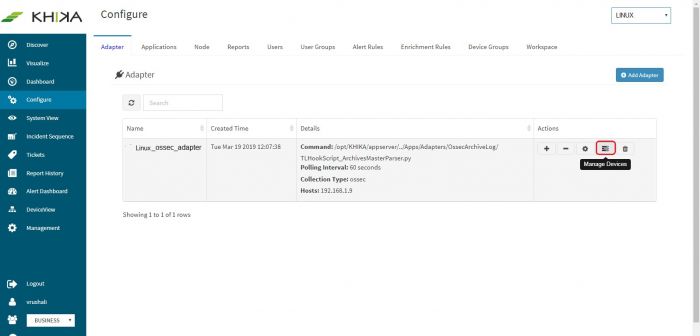
Go to Adapter tab in the “Configure” menu. Next to our “<adapter name>”, click on the “Manage Devices” icon.
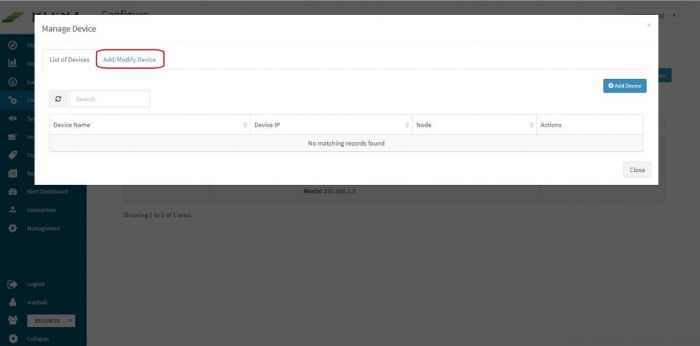
Pop up appears for device details
Click on “Add / Modify Device” tab. Another pop up appears for device details.
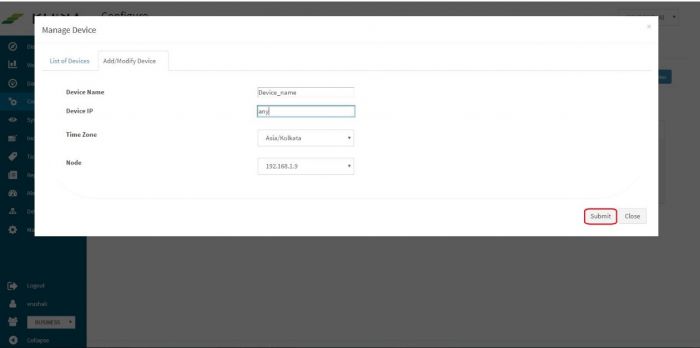
Enter the expected device name and IP Address. Select appropriate time zone of this device. In the “Node” field drop-down, select the name of the Aggregator or local data collector for this device.
Click on Submit. We get a success message and the Checkpoint Firewall device is added successfully to this adaptor.
Verifying SYSLOG data collection
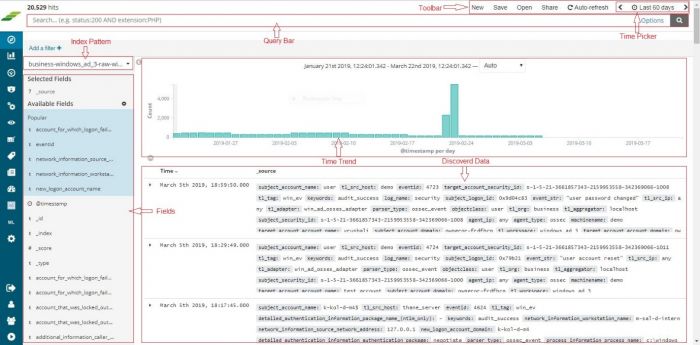
Once the device is added successfully, we can check the data for this device on Discover screen. Go to “Discover” from the main menu. Select the appropriate index for the same. Raw (khika formatted) data of all your <APPLICATION NAME> added in KHIKA so far, is seen here.
To see the data for our newly added device, enter search string in lower case – tl_src_host : name_of_the_device_added_in_lower_case and click on the search icon. and click on the search icon.
How to check the output of KHIKA Checkpoint Firewall App ?
Chekpoint Firewall Malicious Communication Dashboard
Go to "Dashboards" from the left menu. From the list of in-built dashboards, select this one. It shall open the Dashboard. This dashboard focuses on the Checkpoint Firewall communication with suspicious ip and it's traffic status(which are added into KHIKA).Details like which is the malicious ip,which is the source ip and destination ip at that time,actions,service,traffic direction like inbound etc. is shown in the analytical fashion. You can filter and search information and create new ones too. For help with Dashboards, click here
Elements in the Dashboard are explained below :
| Visualization | Description |
| Contribution of Action pie chart | Contribution of actions during communication with malicious ip |
| Contribution of Malicious IP | Contribution of Malicious IP |
| Malicious IP wise Action | X axis : All Malicious IP communicated through firwall Y axis : Actions stacked in one bar(Malicious IP) and the count |
| Source IP wise Hits | X axis : All the Source IP during Malicious Communication Y axis : The count of Source IP during Malicious Communication |
| Destination IP wise Hits | X axis : All the Destination IP during Malicious Communication Y axis : The count of Destination IP during Malicious Communication |
| Daily trend | Trend of malicious communication events over time. Useful to identify unusual spikes at a glance. X axis : date & time Y axis : count of events |
| Summary Table | Detailed data with timestamp and count |
A suggestion for useful interaction with this dashboard could be :
- Click on and select a particular malicious ip in the second pie. The rest of the visualizations reflects all source ip destination ip and actions with this malicious ip.
- For further drill down click on and select particular say accept.Now rest of visualizations reflect for this action also.
Chekpoint Firewall Triggered Signature Dashboard
Go to "Dashboards" from the left menu. From the list of in-built dashboards, select this one. It shall open the Dashboard. This dashboard gives attack information against predefined signatures of attacks. It includes information about source and destination ip and also possible malicious ip among them. What action has been taken by firewall on each is also present. You can filter and search information and create new ones too. For help with Dashboards, click here
Elements in the Dashboard are explained below :
| Visualization | Description |
| Contribution of Action pie chart | Contribution of Actions for signatures of attacks |
| Contribution of Attack pie chart | Contribution of Signature Attacks |
| Source IP wise Attack Hits | X axis : All the Source IP during Signature Attack Y axis : Stacked within each bar (ie. for each signature Attack) the Source IP and count of events |
| Destination IP wise Attack Hits | X axis : All the Source IP during Signature Attack Y axis : Stacked within each bar (ie. for each signature Attack) the Destination IP and count of events |
| Daily trend | Trend of signature attack events over time. Useful to identify unusual spikes at a glance. X axis : date & time Y axis : count of events |
| Summary Table | Detailed data with timestamp and count |
A suggestion for useful interaction with this dashboard could be :
- Click on and select a particular attack in the first pie. The rest of the visualization reflects all source ip destination ip and actions with this attack.
- For further drill down click on and select particular action in the second pie. Now rest of the visualization reflects for this action also.
Chekpoint Firewall VPN Activity Dashboard
Go to "Dashboards" from the left menu. From the list of in-built dashboards, select this one. It shall open the Dashboard. This dashboard gives Checkpoint Firewall VPN activity details. Details like which is the Source IP,Destination IP,VPN user,Interface Name,Policy Name,Interface Direction etc. is shown in the analytical fashion. You can filter and search information and create new ones too. For help with Dashboards, click here
Elements in the Dashboard are explained below :
| Visualization | Description |
| Contribution of VPN User pie chart | Contribution of VPN User |
| Contribution of Action pie chart | Contribution of Actions during VPN |
| Source IP wise Hits | X axis : All the Source IP during VPN Activity Y axis : The count of Source IP during VPN |
| Destination IP wise Hits | X axis : All the Source IP during Signature Attack Y axis : The count of Destination IP during VPN |
| Contribution of Protocol pie chart | Contribution of Protocol during VPN |
| Contribution of Policies | Contribution of Policies during VPN |
| Daily trend | Trend of VPN activity events over time. Useful to identify unusual spikes at a glance. X axis : date & time Y axis : count of events |
| Summary Table | Detailed data with timestamp and count |
A suggestion for useful interaction with this dashboard could be :
- Click on and select a particular user in the first pie. The rest of the visualization reflects all source ip ,destination ip,policies,actions etc with this vpn user.
- For further drill down click on and select particular action in the second pie. Now rest of the visualization reflects for this action also.
Chekpoint Firewall Attack Dashboard
Go to "Dashboards" from the left menu. From the list of in-built dashboards, select this one. It shall open the Dashboard. This dashboard gives Checkpoint Firewall attack information like attack name ,attack information etc. You can filter and search information and create new ones too. For help with Dashboards, click here
Elements in the Dashboard are explained below :
| Visualization | Description |
| Contribution of Attack pie chart | Contribution of Attack |
| Contribution of Malicious IP pie chart | Contribution of Malicious IP in Attacks event |
| Attack wise Attack Info | X axis : All the Attack in Firewall Y axis : Stacked within each bar (ie. for each Attack info) the Attack Name and count of events |
| Source IP wise Hits | X axis : All the Source IP during Signature Attack Y axis : Stacked within each bar (ie. for each Attack) the Source IP and count of events |
| Destination IP wise Hits | X axis : All the Source IP during Signature Attack Y axis : Stacked within each bar (ie. for each Attack) the Destination IP and count of events |
| Daily trend | Trend of Attack events over time. Useful to identify unusual spikes at a glance. X axis : date & time Y axis : count of events |
| Summary Table | Detailed data with timestamp and count |
A suggestion for useful interaction with this dashboard could be :
- Click on and select a particular attack from contribution of attack pie. The rest of the visualization reflects all source ip destination ip and attack info with this attack.
- For further drill down click on and select particular source_ip in the Source wise attack bar. Now rest of the visualization reflects for this Source IP also.
Chekpoint Firewall Audit Admin login Dashboard
Go to "Dashboards" from the left menu. From the list of in-built dashboards, select this one. It shall open the Dashboard. This dashboard gives Checkpoint Firewall login information. It shows status of logins, from where user has logged in, which product is used for login (product like smart dashboard,smart view tracker, smart view monitor etc) You can filter and search information and create new ones too. For help with Dashboards, click here
Elements in the Dashboard are explained below :
| Visualization | Description |
| Contribution of Status pie chart | Contribution of status like success,faliure etc in admin user login events |
| Contribution of Machine pie chart | Machine Name from where admin user was trying to login |
| Admin user wise Status: | X axis : Admin users who has login into Firewall Y axis : Admin users wise login failed and success status and its count |
| Client IP wise Operation | X axis : All client IP in login activity Y axis : Stacked within each bar (ie. for each operation like log in etc) the Client IP and count of events |
| Daily trend | Trend of Admin login events over time. Useful to identify unusual spikes at a glance. X axis : date & time Y axis : count of events |
| Summary Table | Detailed data with timestamp and count |
A suggestion for useful interaction with this dashboard could be :
- Click on and select a particular status from contribution of Status pie. The rest of the visualization reflects all Admin user,Machine Name,Client Name etc info with this attack.
- For further drill down click on and select particular Admin user in Admin wise status bar. Now rest of the visualization reflects for this Admin User also.
Chekpoint Firewall Allowed External Source Dashboard
Go to "Dashboards" from the left menu. From the list of in-built dashboards, select this one. It shall open the Dashboard. This dashboard gives Checkpoint Firewall allowed external source traffic. Here inzone traffic origin is external and these traffic accept by firewall. You can filter and search information and create new ones too. For help with Dashboards, click here
Elements in the Dashboard are explained below :
| Visualization | Description |
| Contribution of Protocol pie chart | Contribution Protocol in allowed external source traffic |
| Contribution of Services pie chart | Contrbution of Services in allowed external source traffic |
| Source IP wise Hits: | X axis : All Source IP in allowed external source traffic Y axis : Source IP wise allowed external source traffic events count |
| Destination IP wise Hits: | X axis : All Source IP in allowed external source traffic Y axis : Destination IP wise allowed external source traffic events count |
| Daily trend | Trend of allowed external traffic events over time. Useful to identify unusual spikes at a glance. X axis : date & time Y axis : count of events |
| Summary Table | Detailed data with timestamp and count |
A suggestion for useful interaction with this dashboard could be :
- Click on and select a particular service from Contribution of Services pie. The rest of the visualization reflects all Source IP,Destination IP,Protocol etc info with this service.
- For further drill down click on and select particular Source IP or Destination IP from Source IP wise Hits and Destination IP wise Hits bar res.Now rest of the visualization reflects for this.
Chekpoint Firewall Blocked External Source Dashboard
Go to "Dashboards" from the left menu. From the list of in-built dashboards, select this one. It shall open the Dashboard. This dashboard gives Checkpoint Firewall blocked external sources traffic ,Here inzone traffic origin is external and these traffic blocked by the firewall. You can filter and search information and create new ones too. For help with Dashboards, click here
Elements in the Dashboard are explained below :
| Visualization | Description |
| Contribution of Protocol pie chart | Contribution Protocol in blocked external source traffic |
| Contribution of Services pie chart | Contribution of Services in blocked external source traffic |
| Source IP wise Hits: | X axis : All Source IP in blocked external source traffic Y axis : Source IP wise blocked external source traffic events count |
| Destination IP wise Hits: | X axis : All Source IP in blocked external source traffic Y axis : Destination IP wise blocked external source traffic events count |
| Daily trend | Trend of blocked external traffic events over time. Useful to identify unusual spikes at a glance. X axis : date & time Y axis : count of events |
| Summary Table | Detailed data with timestamp and count |
A suggestion for useful interaction with this dashboard could be :
- Click on and select a particular service from Contribution of Services pie. The rest of the visualization reflects all Source IP,Destination IP,Protocol etc info with this service.
- For further drill down click on and select particular Source IP or Destination IP from Source IP wise Hits and Destination IP wise Hits bar res.Now rest of the visualization reflects for this.
Chekpoint Firewall Object Manipulation Dashboard
Go to "Dashboards" from the left menu. From the list of in-built dashboards, select this one. It shall open the Dashboard. This dashboard gives Checkpoint Firewall User audit activity report. It shows the activities perform on the firewall, like creating, modifying and deleting objects. It shows the different types of objects and its belonging table name. You can filter and search information and create new ones too. For help with Dashboards, click here
Elements in the Dashboard are explained below :
| Visualization | Description |
| Contribution of Clinet IP pie chart | Contribution of Clinet IP in Object Manipulation Events |
| Contribution of Object Name pie chart | Contribution of Object Name in Object Manipulation Events |
| Contribution of Object Type pie chart | Contribution of Object Type in Object Manipulation Events |
| Administrator wise Operation: | X axis : All Administrator user in Object Manipulation Y axis : Stacked within each bar (ie. for each operation) the Administrator and count of events |
| Daily trend | Trend of object manipulation events over time. Useful to identify unusual spikes at a glance. X axis : date & time Y axis : count of events |
| Summary Table | Detailed data with timestamp and count |
A suggestion for useful interaction with this dashboard could be :
- Click on and select a particular object type from Contribution of Object Type pie. The rest of the visualization reflects all Object Name,Client IP,Operation etc info with this object type.
- For further drill down click on and select particular Administrator user from Operation wise bar .Now it will show operations like modify rule,create object,modify object for that Administrator user
Chekpoint Firewall Alerts
Alerts are generated when certain critical behavior is observed in the system – real time and notified on the Alerts Dashboard in KHIKA as well as can be received in email to relevant stakeholders. The details of KHIKA Alerts are mentioned here Click on “Alert Dashboard” on left menu.
Certain alerts for Checkpoint Firewall are pre-canned and shipped with KHIKA, keeping in mind the requirements of the users. They are mentioned in the table below :
Alerts Description
| Alert Name | Description | Suggested Resolution |
| Checkpoint firewall Possible data exfiltration | This alert is triggered when large amount of data (more than 5 MB ) being sent to an external network. | This alert is detected when a large amount of data is uploaded on external sites. This may be an attempt of data ex-filtration from the organisation.
Please check the real user associated with the source IP and the workstation from which the data upload happened. Verify if sensitive data was ex-filtrated. |
| Checkpoint firewall Checkpoint control log message | This alert is triggered when action is act. | Checkpoint internal message is generated. Please check the documentation of Checkpoint and do the suggested action. |
| Checkpoint firewall Possible icmp probe | This alert is triggered when high inbound icmp requested is accepted | ICMP probe is an old and established technique used by attackers as the first step that involves reconnaissance. This is used to check what IPs/Hosts are responding to the ping request so that further targeted can be launched on the responding IPs/Hots. The probing IP, if not a legitimate IP, ,it should be blocked at the periphery. Check the reputation of the probing IP in external reputation databases, such as VirtusTotal.com or IPVoid.com etc. If the reputation is found to be dubious or bad, you must block such IPs. |
| Checkpoint firewall IPS bypassing | This alert is triggered when ips is bypassed. | The firewall IPS mode is enabled by default in NextGen firewalls. However, sometimes the firewall runs out of its resources, such as CPU or Memory due sudden heavy load. In such cases, the firewall disables the IPS mode so that it can service the traffic traffic. Disabled IPS mode on the peripheral firewall is a compromised operating mode as an attacker can invade into your network by exploiting the lack of IPS service on your firewall. |
| Checkpoint firewall Worm detected | This alert is triggered when traffic is generated on port 445,137,138,139 and interface direction is inbound | Log messages indicative of a worm are detected. Check the attacking IPs in question. Verify the reputation these IPs in reputation databased such as virustotal.com, ipvoid.com etc. |
| Checkpoint firewall Backdoor activity detected | This alert is triggered when traffic is generated from internal machine on vulnerable ports(3127,3198,6129,7080). | This event indicates that a traffic is generated from internal machine on vulnerable ports(3127,3198,6129,7080). Typically, these ports are used by attacker to exploit vulnerable programs listening on these ports. Check is these ports are open and on what servers. Do you really need these ports opened? Check what programs are running on these ports. Check vulnerability reports of the applications Block these ports for external traffic, unless mandatory to keep them opened. If you have to keep any of these ports opened, try to restrict the access to legitimate IPs. If you get a suspicious IP repetitively trying to access these port, block the IP. Check the reputation of the IP on popular website such as ipvoid.com, virustotal.com etc. |
| Checkpoint firewall Communication with possible IOC or bad IP | This alert is triggered when source ip or destination ip a malicious ip and action is accept. | KHIKA shares community based threat intelligence (TI) every 24 hours. TI has list of IP addresses with bad reputation. Every bad IP is marked with number of communities reporting it, name of each community and confidence indicating how confident are we about the reputation. This alert is generated when communication with a bad IP is let through. If communication with a bad IP is happening, it must be blocked immediately as it could be a possible attack or data ex-filtration. You can check how log this communication is happening by simply searching the malicious IP in the logs. You can also check what internal IP addresses are communicating with this IP addresses and track the real users behind those internal IP addresses. Cross-check the reputation of the IP with popular websites such as ipvoid.com, virustotal.com If you see an internal IP constantly getting involved in malicious communication (with same or multiple external IP addresses), you may install agents on the internal nodes involved and check the real user and process responsible for this communication. It is critical to block this rogue communication. |
| Checkpoint firewall host scan activity by malicious ip | This alert is triggered when same source ip which is malicious is trying to generate traffic on one destination ip across more than 10 different port but all the time request is denied . This happens within 1 minute. | Bad ip address tries to spray connection requests on multiple popular ports (21,22,53,80,443 etc) targeting one single IP address at a time with an intention to find the open ports on the target IP address. Typically, scan attempt is the first stage of reconnaissance in the attack life cycle. It is important to check the reputation of the external ip address and block the same if necessary. |
| Checkpoint firewall successful host scan activity | This alert is triggered when same source ip is trying to generate traffic on one destination ip across more than 10 different ports but all the time request is denied .After that same source ip is trying to connect to same destination ip on one more port and this time it successfully connected on that port. This happens within 1 minute. | Attacker tries to spray connection requests on multiple popular ports (21,22,53,80,443 etc) targeting one single IP addresses at a time with an intention to find the open ports on the target IP address. Typically, scan attempt is the first stage of reconnaissance in the attack life cycle and attacker done successful connection on open ports It is important to check the reputation of the suspected ip address. If the suspected ip address is external, you may consider blocking it. If the suspected ip address is internal, you may need to verify the sanity of the corresponding device It is also important to verify the sanity of affected internal nodes by checking if any unwarranted system policy change or software configuration/updates have occurred during the affected time period. If required, quarantine the affected servers till the time the issues are resolved. This may be a false positive. |
| Checkpoint firewall successful host scan activity by malicious ip | This alert is triggered when same source ip is trying to generate traffic on one destination ip across more than 10 different ports, but all the port request is denied .After that same source ip is trying to connect to same destination ip on one more port and this time it successfully connected on that port. This happens within 1 minute. | Bad ip address tries to spray connection requests on multiple popular ports (21,22,53,80,443 etc) targeting one single IP addresses at a time with an intention to find the open ports on the target IP address. Typically, scan attempt is the first stage of reconnaissance in the attack life cycle and attacker done successful connection on open ports It is important to check the reputation of the external ip address and block the same if necessary. It is also important to verify the sanity of affected internal nodes by checking if any unwarranted system policy change or software configuration/updates have occurred during the affected time period. If required, quarantine the affected servers till the time the issues are resolved. |
| Checkpoint firewall sweep scan attack by malicious ip | This alert is triggered when same source ip which is malicious is trying to generate traffic across more than 10 destination ip but all the time request is denied . This happens within 1 minute. | Attacker tries to spray connection requests on one of the popular ports (21,22,53,80,443 etc) on multiple IP addresses with an intention to find which ports are opened on what IP addresses. Typically, scan attempt is the first stage of reconnaissance in the attack life cycle and attacker done successful connection
Bad ip addresses tries to spray connection requests on one of the popular ports (21,22,53,80,443 etc) on multiple IP addresses with an intention to find which ports are opened on what IP addresses. Typically, scan attempt is the first stage of reconnaissance in the attack life cycle. |
| Checkpoint firewall successful sweep scan activity | This alert is triggered when same source ip is trying to generate traffic across more than 10 destination ip but all the time request is denied .After that same source ip is trying to connect to one more destination ip and this time it successfully connected with destination ip. This happens within 1 minute. | Attacker tries to spray connection requests on one of the popular ports (21,22,53,80,443 etc) on multiple IP addresses with an intention to find which ports are opened on what IP addresses. Typically, scan attempt is the first stage of reconnaissance in the attack life cycle and attacker done successful connection on one of ip addresses
It is important to check the reputation of the suspected ip address. If the suspected ip address is external, you may consider blocking it. If the suspected ip address is internal, you may need to verify the sanity of the corresponding device It is also important to verify the sanity of affected internal nodes by checking if any unwarranted system policy change or software configuration/updates have occurred during the affected time period. If required, quarantine the affected servers till the time the issues are resolved. This may be a false positive. |
| Checkpoint firewall successful sweep scan activity by malicious ip | This alert is triggered when same source ip which is malicious is trying to generate traffic across more than 10 destination ip but all the time request is denied .After that same source ip is trying to connect to one more destination ip and this time it successfully connected with destination ip. This happens within 1 minute. | Bad ip address tries to spray connection requests on one of the popular ports (21,22,53,80,443 etc) on multiple IP addresses with an intention to find which ports are opened on what IP addresses. Typically, scan attempt is the first stage of reconnaissance in the attack life cycle and attacker finds open port on one of ip addresses and is able to establish a connection.
It is important to check the reputation of the external ip address and block the same if necessary. It is also important to verify the sanity of affected internal nodes by checking if any unwarranted system policy change or software configuration/updates have occurred during the affected time period. If required, quarantine the affected servers till the time the issues are resolved. |
| Checkpoint firewall communication with suspicious ip | This alert is triggered when bytes are sent and received during communication with malicious ip within 1 minute. | Communication with a bad IP is happening, it must be blocked immediately as it could be a possible attack or data ex-filtration.
You can check the log for this communication by simply searching the malicious IP in the logs. You can also check which internal IP addresses are communicating with this IP address and track the real users behind those internal IP addresses. |
| Checkpoint firewall large data sent outside | This alert is triggered when large amount of data (more than 1 GB) being sent to an external network | Large amount of data being sent to an external network could be an indication of data ex-filtration.
Check with the user or process which is responsible for the data being sent out and whether it was done for legitimate business reasons. This could be a false positive.
|
