KHIKA App for Seqrite Utm Firewall
Contents
Introduction
Firewall form an important part of organisations’ networks and hence by monitoring your firewall is imperative. Seqrite UTM Firewall send the traffic and user activity related information in the form of logs over syslog protocol. KHIKA Data Aggregator is pre-configured with syslog services on port 514. The key parts to get here are :
- Enabling Syslog forwarding on the device
- Install the KHIKA App for Checkpoint Firewall
- Get data from your Checkpoint Firewall into KHIKA Aggregator
Enabling Syslog forwarding on the device
Please refer to [1] for enabling syslogs on your firewall device.
Example of command to be fired on Firewall Device to enable syslogs:
cp_log_export add name <name> [domain-server <domain-server>] target-server <target-server IP address> target-port <target-port> protocol <(udp|tcp)> format <(syslog)|(cef)|(splunk)(generic)>
   name          :Unique name of the exporter configuration.
   domain-server :The relevant domain-server name or IP
   target-server :Exporting the logs to this ip address
   target-port   :The port on which the target is listening to.Here use port 514
   protocol      :Transport protocol to use.Here use protocol udp
   format        :The format in which the logs will be exported .Here use format cef
Verifying SYSLOG data collection
After you enable the syslog forwarding on the end device, you must verify if the logs are being really received by KHIKA Data Aggregator. Please refer here to understand how to verify syslogs on KHIKA Data Aggregator.
How to Install the KHIKA App for Checkpoint Firewall ?
It is assumed, that you have already configured KHIKA Data Aggregator in your environment. If not, please read how to configure KHIKA Data Aggregator and perform the pre-requisite steps.
This section explains how to pick and install the KHIKA application for Checkpoint Firewall - Checkpoint Firewall. Installing the application shall put together and activate the adapter (parser) that can handle Checkpoint Firewall data format, the dashboards and the alert rules preconfigured.
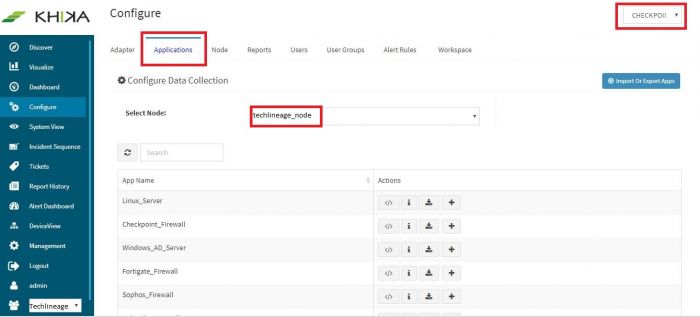
Go to “Applications” tab in the “Configure” menu.
Check whether the appropriate Workspace is selected. Note: Application is always loaded in a Workspace. Read the section on Workspaces to know more about KHIKA Workspaces. Also select your KHIKA aggregator name in the Node dropdown. This is to ensure that we are collecting data from the desired source and into the correct workspace which is ready with the configured application and components.
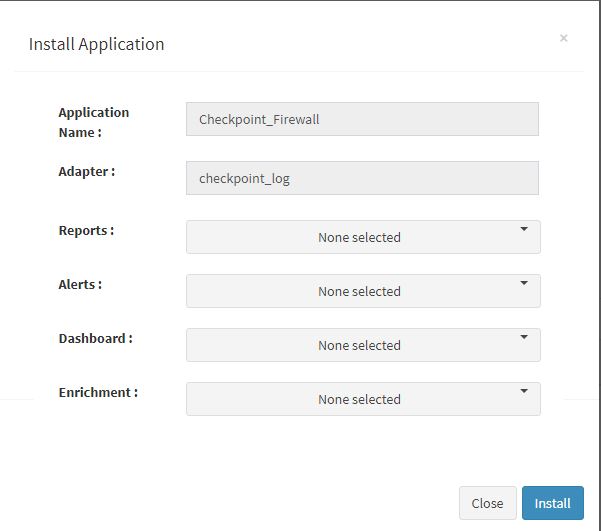
Click on the “+” button. A pop up appears.
User can now select the contents of the application required. For example, on the dropdown for “Reports”, click to expand it. List of all reports can be seen. User can individually select the reports required by checking on the checkbox next to each. Alternatively, check on “Select All” option to get all of them. Similarly you can select contents from Alerts and Dashboards.
Visit the sections on KHIKA Reports, KHIKA Dashboards, KHIKA Alerts & Correlations to know more about these topics.
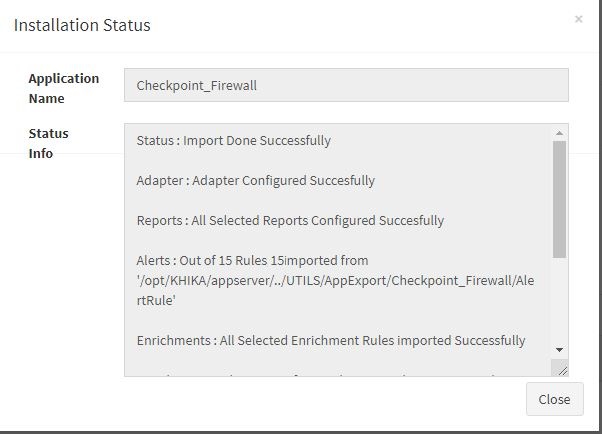
Click “OK” to proceed with the installation of the selected Application. After successful installation, following status should be displayed :
This simple procedure to install a KHIKA App, automatically configures the Adapter (required for parsing the data from raw syslogs), calculated KHIKA reports on raw data, Visualizations, Dashboards and Alerts – all in one click.
Adding the device in the Adaptor
After syslogs are enabled on the device and the App is installed into KHIKA, it is the time to add the device to the this App (in Adapter section of KHIKA Web GUI). Please refer here to know how to add the device to an App.
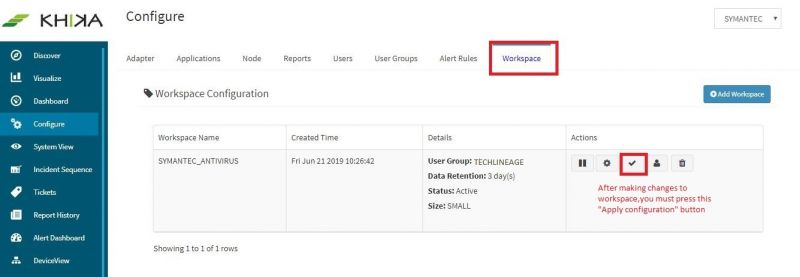
After making these configuration in KHIKA, you must apply these changes to the Workspace. Go to Configure, select the Workspace and in Workspace tab of configure menu press the Apply button as shown in the screenshot below.
Wait for a few minutes for changes to apply and data to arrive in kHIKA. With all these steps, we should now expect the data to arrive in KHIKA. Lets discover some live data in KHIKA.


