Difference between revisions of "Discover or Search Data in KHIKA"
| Line 310: | Line 310: | ||
If data is not seen in the “Discover” screen at all, for troubleshooting, try changing the time window. | If data is not seen in the “Discover” screen at all, for troubleshooting, try changing the time window. | ||
| + | |||
[[Getting Data into KHIKA|Previous]] | [[Getting Data into KHIKA|Previous]] | ||
| + | |||
| + | |||
Go to the next section for understanding and creating [[KHIKA Visualizations]] | Go to the next section for understanding and creating [[KHIKA Visualizations]] | ||
Revision as of 06:09, 6 June 2019
Contents
Introduction
In the previous sections, we saw how to set up KHIKA and add data. As the data is received in our system, we can begin with exploring it. Please Note: Raw data is taken into our system with the help of adaptors. Adaptors normalise and index this data. This indexed data is closest to the raw data received albeit in an organised, formatted manner. Hence it shall be referred to often, as raw data.
Discover or Search Data
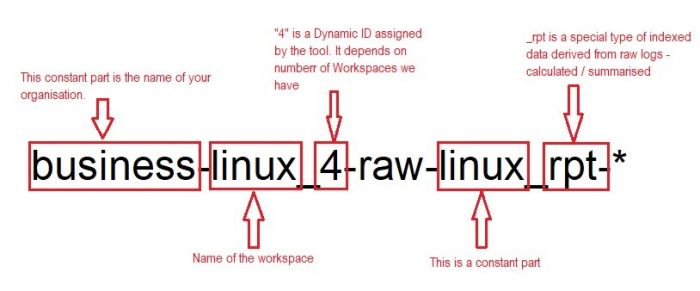
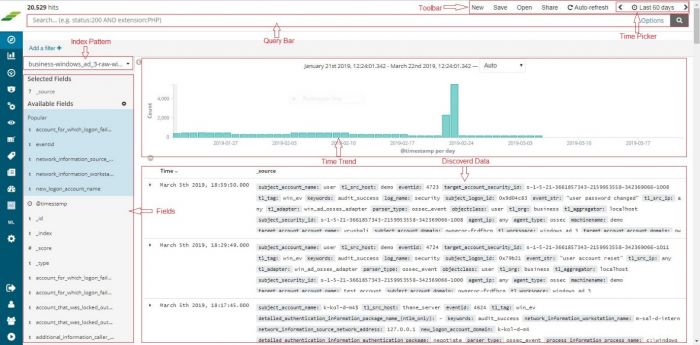
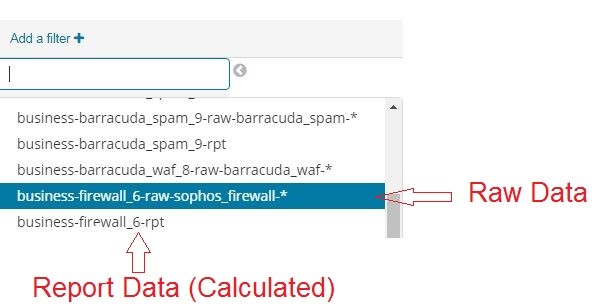
You can interactively explore your data from the Discover page. You have access to every document (a single line of message formatted into key-value pairs) in every index that matches the selected index pattern. You can submit search queries, filter the search results, and view document data. You can also see the number of documents that match the search query and get field value statistics. If a time field is configured for the selected index pattern, the distribution of documents over time is displayed in a histogram at the top of the page. An Index pattern is a collection of documents (logs) and decides the data type, whether it is raw data received or calculated report data. Two types of index patterns available for any type of data:
- business-linux_4-raw-linux-* : represents raw data of Linux server. It is all the raw data logs but parsed and formatted by the adapter.
- business-linux_4-raw-linux_rpt-* : represents report data of Linux server which is calculated from raw data. The “_rpt” index is summarised form of the raw data. Most of the visualisation and dashboards will use this index as the summarised data helps KHIKA to scale better. It shows users the insights into their data like count, compliance status, any enrichments to data etc.
Do note the “raw” and “rpt” keywords in the index names that help us identify raw data and the summarised/calculated report data respectively.
Setting the Time Filter
The time filter restricts the search results to a specific time period. You can set a time filter if your index contains time-based events and a time-field is configured for the selected index pattern. By default the time filter is set to the last 15 minutes. This means, you can discover the data collected in last 15 minutes. You can use the Time Picker to change the time filter or select a specific time interval or time range in the histogram at the top of the page.
To set a Time Filter with a Time Picker
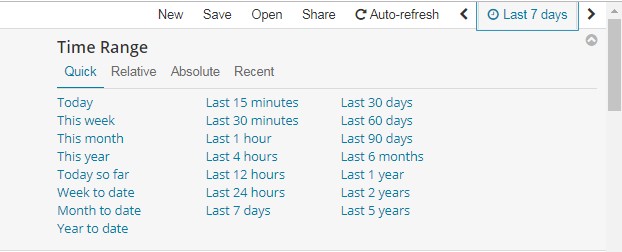
Click the Time Picker in the toolbar. To set a Quick filter, click one of the shortcut links.
Caution: Selecting large Time Range may severely affect the performance of KHIKA. We recommend not selecting the data beyond Last 24 hours. Your searches may time out if you select large Time Ranges.
If you are not able to see any data in the “Discover” screen after above step, try changing the time window.
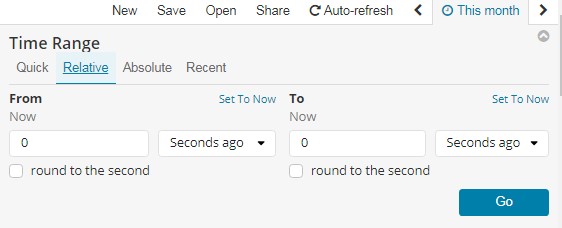
To specify a time filter relative to the current time, click Relative and specify the start time as number of seconds, minutes, hours, days, months, or years. You can also specify the end time relative to the current time. Relative times can be in the past or future
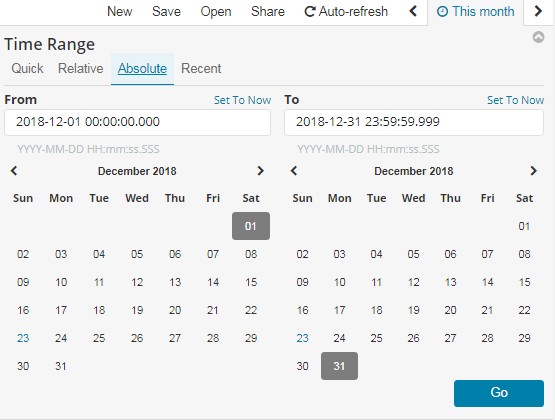
To specify both the start and end times for the time filter, click Absolute and select a start and end date. You can adjust the time by editing the To and From fields.
Click the caret in the bottom right corner to close the Time Picker.
Set a time filter from the histogram
Do one of the following for setting a filter in this way.
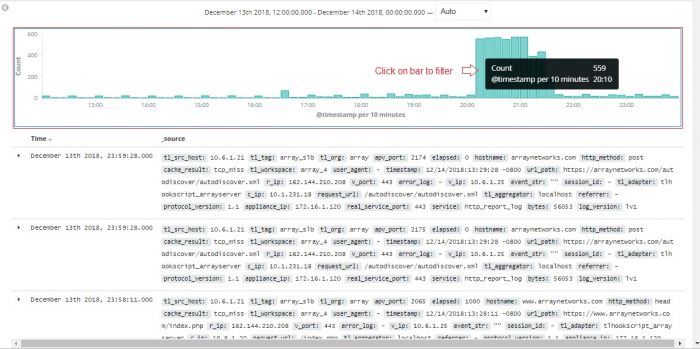
- Click the bar that represents the time interval you want to zoom in on.
- Click and drag to view a specific timespan. You must start the selection with the cursor over the background of the chart—the cursor changes to a plus sign when you hover over a valid start point.
To move forward/backward in time, click the arrows to the left or right of the Time Picker
You can use the browser Back button to undo your changes.
The displayed time range and interval are shown on the histogram. By default, the interval is set automatically based on the time range. To use a different interval, click the link and select an interval.
Searching Your Data
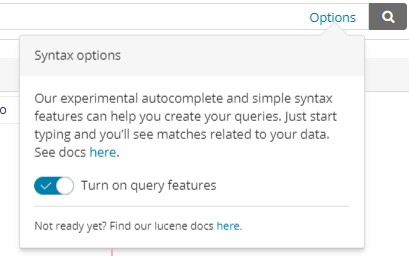
You can search the indices that match the current index pattern by entering your search criteria in the Query bar. You can use standard query language (based on Lucene query syntax) or the full JSON-based Elasticsearch Query DSL. Autocomplete and a simplified query syntax are available for the query language as experimental features which you can opt-in to under the “options” menu in the Query Bar.
Caution: Autocomplete feature may slow down KHIKA and cause performance bottlenecks. We recommend you turn it off when not required. As you become familiar with the data, fields and its values, you are advised to turn it off.
When you submit a search request, the histogram, Documents table, and Fields list are updated to reflect the search results. The total number of hits (matching documents) is shown in the toolbar. The Documents table shows the first five hundred hits. By default, the hits are listed in reverse chronological order, with the newest documents shown first. You can reverse the sort order by clicking the Time column header. You can also sort the table by the values in any indexed field. For more information, see Sorting the Documents Table.
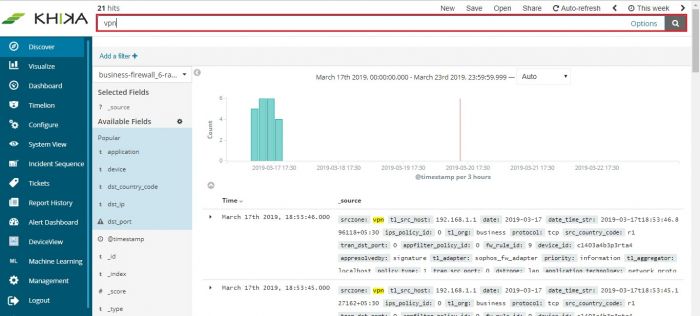
To search your data, enter your search criteria in the Query bar and press Enter or click Search to submit the request to Elasticsearch.
Lucene Query Syntax
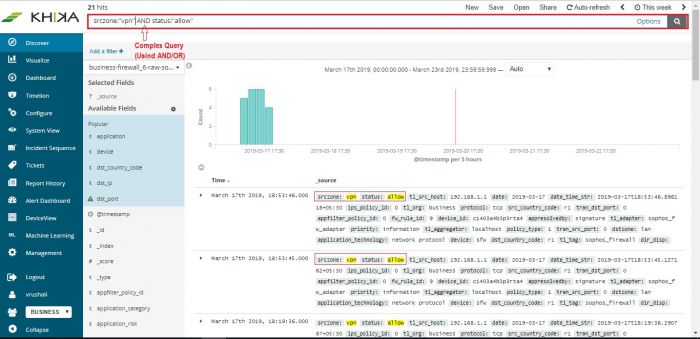
The search queries of KHIKA are based on Lucene query syntax. The following are some tips that can help get you started. To perform a free text search, simply enter a text string. For example, if you’re searching say, Firewall, you could enter “vpn” – one of the source zone.
To search for a value in a specific field, prefix the value with the name of the field. For example, you could enter “status:404” to find all of the entries for this specific destination IP only.
To search for a range of values, you can use the bracketed range syntax, [START_VALUE TO END_VALUE].
Example, to find entries that have srczone as vpn, you could enter srczone:vpn
The ‘colon’ (‘:’) character is treated as equal-to (‘=’)
To specify more complex search criteria, you can use the Boolean operators AND, OR, and NOT.
Saving and Opening Searches
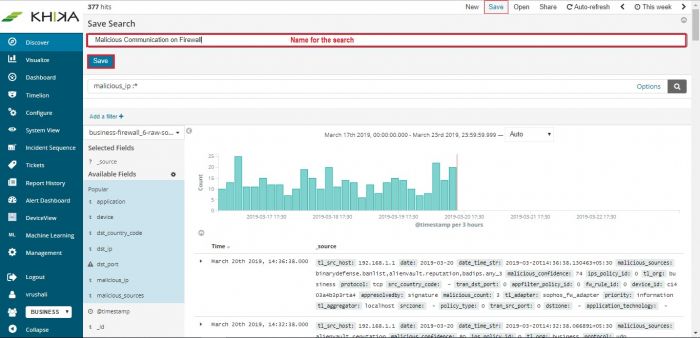
Saving searches enables you to reload them into Discover and use them as the basis for visualizations. Saving a search saves both the search query string and the currently selected index pattern. Saving a Search To save the current search:
- Click Save in the toolbar.
- Enter a name for the search and click Save.
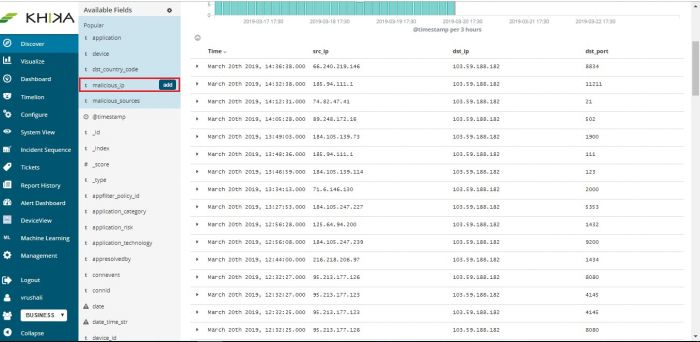
Also, you can add specific columns for the saved search string.
- Click on Add button in the available fields for specific index.
- And then click on save button.
Opening a Saved Search
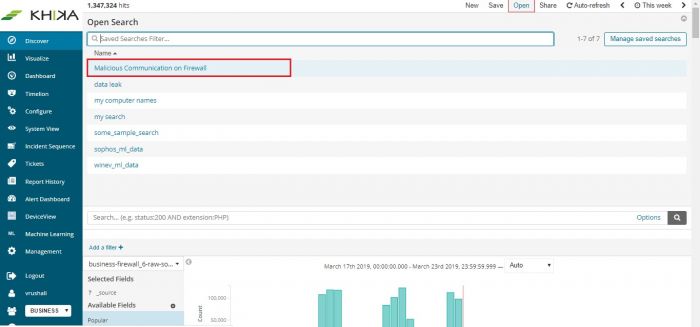
To load a saved search into Discover:
- Click Open in The toolbar.
- Select the search you want to open.
If the saved search is associated with a different index pattern than is currently selected, opening the saved search changes the selected index pattern. The query language used for the saved search will also be automatically selected.
Changing the Index
When you submit a search request, the indices that match the currently-selected index pattern are searched. The current index pattern is shown below the toolbar. To change which indices you are searching, click the index pattern and select a different index pattern.
Refreshing the Search Results
As more documents are added to the indices you’re searching, the search results shown in Discover and used to display visualizations get stale. You can configure a refresh interval to periodically resubmit your searches to retrieve the latest results. Caution: Do not set too frequent (small) auto refresh interval as the search requests query the database and may cause performance issues on busy a system. We recommend setting Auto Refresh interval to more than 5 minutes. To enable auto refresh:
- Click Auto refresh in The toolbar.
- Choose a refresh interval from the list.
When auto refresh is enabled, the refresh interval is displayed next to the Time Picker, along with a Pause button. To temporarily disable auto refresh, click Pause.
If auto refresh is not enabled, you can manually refresh visualizations by clicking Refresh.
Filtering by Field
You can filter the search results to display only those documents that contain a particular value in a field. You can also create negative filters that exclude documents that contain the specified field value. You add field filters from the Fields list, the Documents table, or by manually adding a filter. In addition to creating positive and negative filters, the Documents table enables you to filter on whether or not a field is present. The applied filters are shown below the Query bar. Negative filters are shown in red. Negative filters are reverse or exclusion filters. They show all values except the selected value.
To add a filter from the fields list:
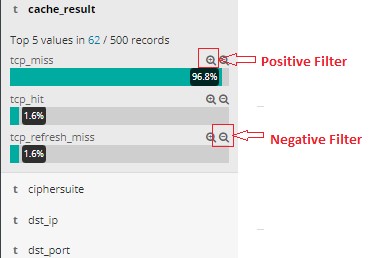
- Click the name of the field you want to filter on. This displays the top five values for that fields.
- To add a positive filter, click the Positive Filter button. This includes only those documents that contain that value in the field.
- To add a reverse / exclusion filter, click the Negative Filter button. This excludes documents that contain that value in the field.
To add a filter from the Documents table:
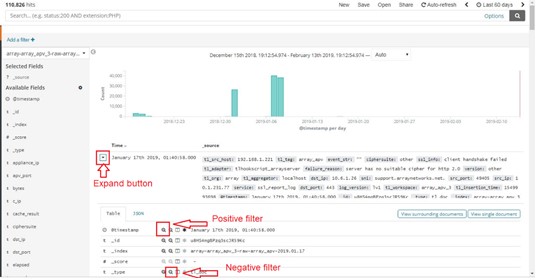
- Expand a document in the Documents table by clicking the Expand button “►” to the left of the document’s table entry. This will show the complete log message with key and value in the message.
- To add a positive filter, click the Positive Filter button to the right of the field name. This includes only those documents that contain that value in the field.
- To add a reverse / exclusion filter, click the Negative Filter button to the right of the field name. This excludes documents that contain that value in the field.
- To filter on whether or not documents contain the field, click the Exists button to the right of the field name. This includes only those documents that contain the field.
To manually add a filter
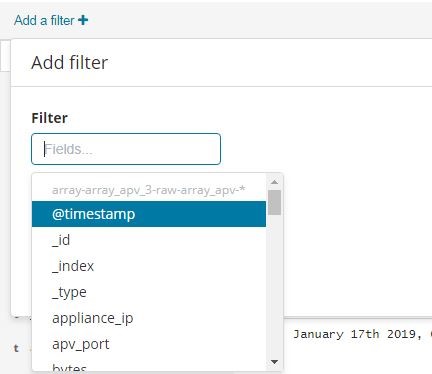
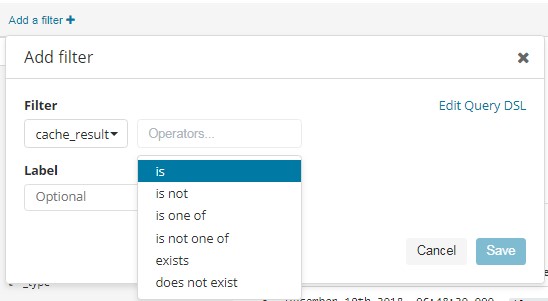
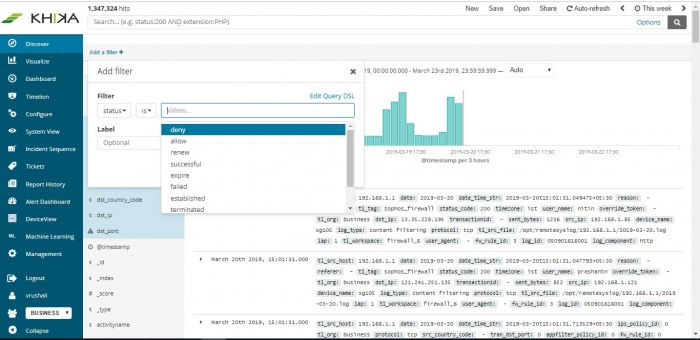
- Click Add Filter. A popup will be displayed for you to create the filter.
- Choose a field to filter by. This list of fields will include fields from the index pattern you are currently querying against.
- Choose an operation for your filter.
The following operators can be selected:
| Operator | Behaviour |
|---|---|
| Is | Filter where the value for the field matches the given value. |
| is not | Filter where the value for the field does not match the given value. |
| is one of | Filter where the value for the field matches one of the specified values. |
| is not one of | Filter where the value for the field does not match any of the specified values. |
| is between | Filter where the value for the field is in the given range. |
| is not between | Filter where the value for the field is not in the given range. |
| Exists | Filter where any value is present for the field. |
| does not exist | Filter where no value is present for the field. |
- Choose the value(s) for your filter. Values from your indices may be suggested as selections if you are filtering against an aggregable field.
- Optionally Specify a label for the filter. If you specify a label, it will be displayed below the query bar instead of the filter definition.
- Click Save. The filter will be applied to your search and be displayed below the query bar.
Managing Filters
To modify a filter, hover over it and click one of the action buttons.
Disable the filter without removing it. Click again to re-enable the filter. Diagonal stripes indicate that a filter is disabled.
Pin the filter. Pinned filters persist when you switch contexts in KHIKA. For example, you can pin a filter in Discover and it remains in place when you switch to Visualize. Note that a filter is based on a particular index field—if the indices being searched don’t contain the field in a pinned filter, it has no effect.
Switch from a positive filter to a negative filter and vice-versa.
Remove the filter.
Edit the filter definition : Enables you to manually update the filter and specify a label for the filter.To apply a filter action to all of the applied filters, click Actions and select the action.
Viewing Document Data
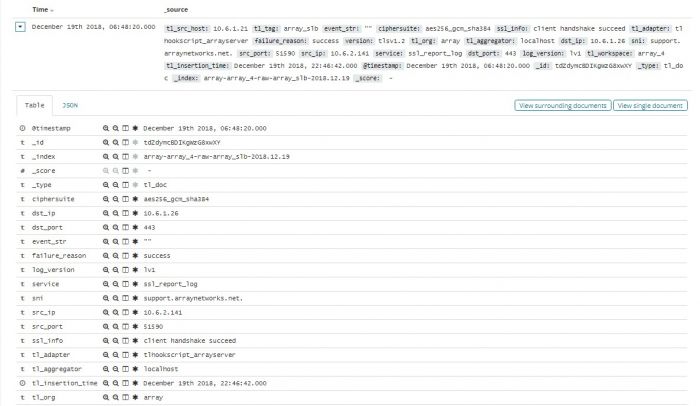
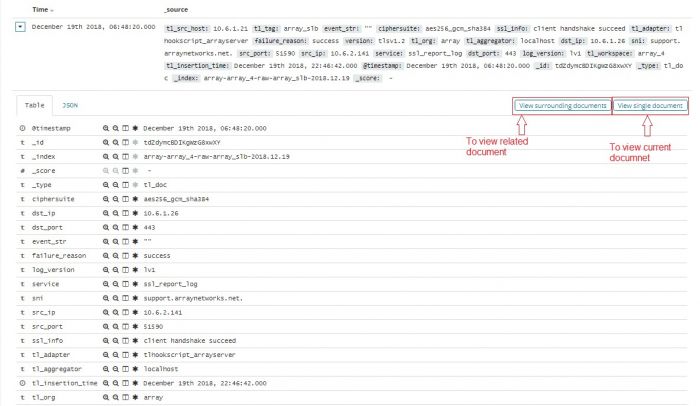
To view a document’s field data, click the Expand button to the left of the document’s table entry.
- To view the original JSON document (pretty-printed), click the JSON tab.
- To view the document data as a separate page, click the View single document link. You can bookmark and share this link to provide direct access to a particular document.
If data is not seen in the “Discover” screen at all, for troubleshooting, try changing the time window.
Go to the next section for understanding and creating KHIKA Visualizations
