Difference between revisions of "KHIKA App for Fortigate Firewall"
| Line 41: | Line 41: | ||
After successful installation, following status should be displayed : | After successful installation, following status should be displayed : | ||
| − | [[File: | + | [[File:fortigate_application_status.jpg|700px]] |
This simple procedure to install a KHIKA App, automatically configures the Adapter (required for parsing the data from raw syslogs), calculated KHIKA reports on raw data, Visualizations, Dashboards and Alerts – all in one click. | This simple procedure to install a KHIKA App, automatically configures the Adapter (required for parsing the data from raw syslogs), calculated KHIKA reports on raw data, Visualizations, Dashboards and Alerts – all in one click. | ||
Revision as of 12:23, 19 June 2019
Contents
- 1 Introduction
- 2 Enabling Syslog forwarding on the device
- 3 How to Install the KHIKA App for Fortigate Firewall?
- 4 How to get your Fortigate Firewall into KHIKA ?
- 5 Adding the device in the Adaptor
- 6 Verifying SYSLOG data collection
- 7 How to check the output of KHIKA Fortigate App ?
Introduction
Most of the network devices, such as firewalls, switches, routers, web proxies etc send the traffic and user activity related information in the form of logs over syslog protocol. Some applications such as Oracle database server, Symantec antivirus server, EMC SAN Storage etc also support syslog protocol as syslog is very efficient and simple to integrate with. KHIKA Data Aggregator is pre-configured with syslog services on port 514. The key parts to get here are :
- Enabling Syslog forwarding on the device
- Install the KHIKA App for Fortigate Firewall
- Get data from your Fortigate Firewall into KHIKA Aggregator
Enabling Syslog forwarding on the device
For help to enable the syslog forwarding go to link here
How to Install the KHIKA App for Fortigate Firewall?
It is assumed, that you have already configured KHIKA Data Aggregator in your environment. If not, please read how to configure KHIKA Data Aggregator and perform the pre-requisite steps.
This section explains how to pick and install the KHIKA application for Fortigate Firewall . Installing the application shall put together and activate the adapter (parser) that can handle Fortigate Firewall data format, the dashboards and the alert rules preconfigured.
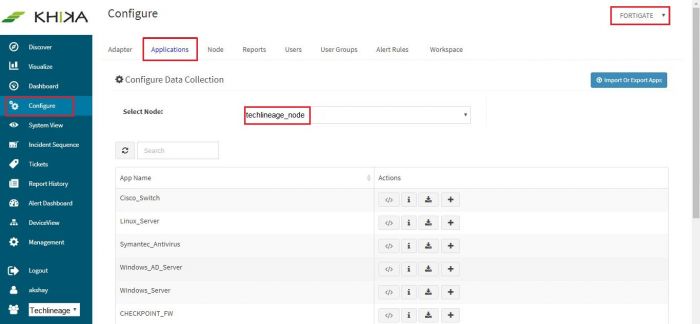
Go to “Applications” tab in the “Configure” menu.
Check whether the appropriate Workspace is selected. Note: Application is always loaded in a Workspace. Read the section on Workspaces to know more about KHIKA Workspaces. Also select your KHIKA aggregator name in the Node dropdown. This is to ensure that we are collecting data from the desired source and into the correct workspace which is ready with the configured application and components.
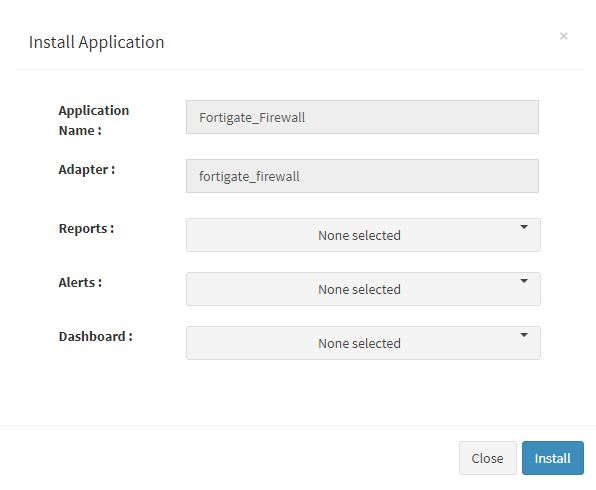
Click on the “+” button. A pop up appears.
User can now select the contents of the application required. For example, on the dropdown for “Reports”, click to expand it. List of all reports can be seen. User can individually select the reports required by checking on the checkbox next to each. Alternatively, check on “Select All” option to get all of them. Similarly you can select contents from Alerts and Dashboards.
What are KHIKA Reports What are KHIKA Dashboards What are KHIKA Alerts
Click “OK” to proceed with the installation of the selected Application. After successful installation, following status should be displayed :
This simple procedure to install a KHIKA App, automatically configures the Adapter (required for parsing the data from raw syslogs), calculated KHIKA reports on raw data, Visualizations, Dashboards and Alerts – all in one click.
How to get your Fortigate Firewall into KHIKA ?
KHIKA recommends, popular syslog forwarding to monitor the Fortigate Firewall You must configure the network device (or the end node) to send its logs to KHIKA Data Aggregator by providing IP address of Data Aggregator and port 514 so that the device can send its logs to KHIKA syslog service. (Please refer the documentation of individual device/vendor/OEM to understand how to configure remote syslogging for the device. Many vendors support web based configuration these days and some vendors support command based configurations)
NOTE: You will have to repeat these steps on each of the Fortigate Firewall that you wish to monitor using KHIKA.
Adding the device in the Adaptor
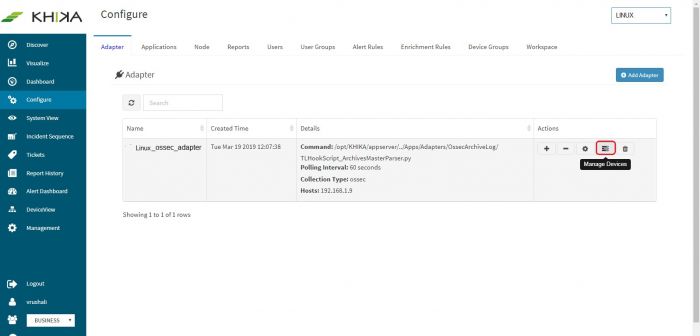
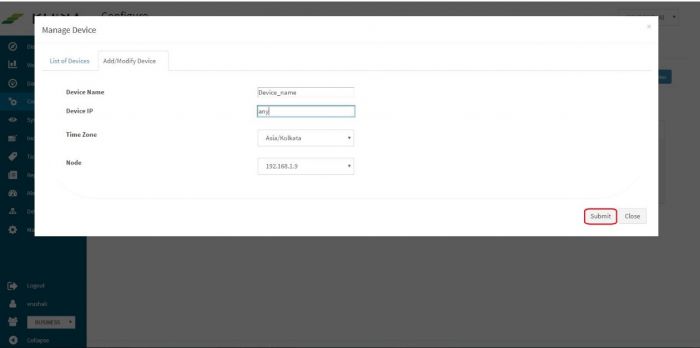
Go to Adapter tab in the “Configure” menu. Next to our “<adapter name>”, click on the “Manage Devices” icon.
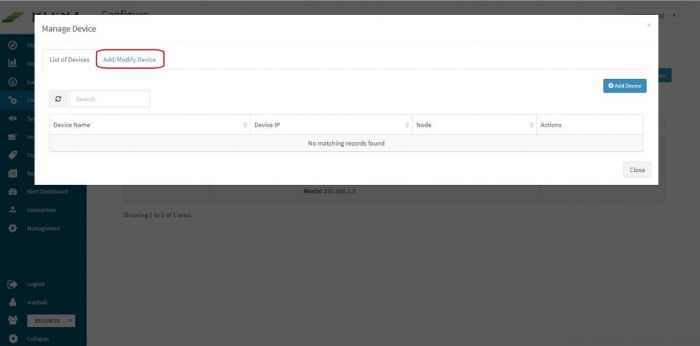
Pop up appears for device details
Click on “Add / Modify Device” tab. Another pop up appears for device details.
Enter the expected device name and IP Address. Select appropriate time zone of this device. In the “Node” field dropdown, select the name of the Aggregator or local data collector for this device.
Click on Submit. We get a success message and the Fortigate Firewall device is added successfully to this adaptor.
Verifying SYSLOG data collection
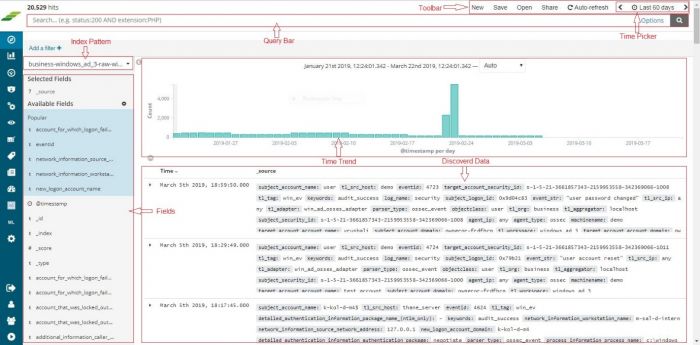
Once the device is added successfully, we can check the data for this device on Discover screen. Go to “Discover” from the main menu. Select the appropriate index for the same. Raw (khika formatted) data of all your Fortigate Firewall added in KHIKA so far, is seen here.
To see the data for our newly added device, enter search string in lower case – tl_src_host : name_of_the_device_added_in_lower_case and click on the search icon. and click on the search icon.
How to check the output of KHIKA Fortigate App ?
Fortigate Firewall Attack Dashboard
Go to "Dashboards" from the left menu. From the list of in-built dashboards, select this one. It shall open the Dashboard. This dashboard focuses on the attack information like attack name and action on fortigate firewall (which are added into KHIKA). Details like attack wise action,sourceIP and destinationIP wise attack hits etc. You can filter and search information and create new ones too. For help with Dashboards, click here
Elements in the Dashboard are explained below :
| Visualization | Description |
| Attack wise Action bar graph | X axis : Differnt types of attack(s) on fortigate firewall Y axis : Action(s) performed on attack and it's count. |
| Contribution of Severity and Action pie chart | Different types of Severity like critical and Action(s) performed like clear_session on fortiagte firewall. |
| SourceIP wise Attack bar graph | X axis : One or more source IP(s). Y axis : Differnt types of attack(s) and it's count. |
| DestinationIP wise Attack bar graph | X axis : One or more Destination IP(s). Y axis : Differnt types of attack(s) and it's count. |
| Time trend | Trend of login events over time. Useful to identify unusual spikes at a glance. X axis : date & time Y axis : count of events |
| Contribution of Service pie chart | Contibution of differnt types of services like https,ping on fortigate firewall. |
| Summary Table | Detailed data with timestamp and count |
Suggestion for useful interaction with this dashboard could be :
- Click on “Attack” in the "Attack wise Action" bar graph. This gets selected and shows the different types of attack(s) and action(s) on fortigate firewall.
- The next bar shall show sourceIP and destinationIP wise attack hits on fortigate firewall.
- The next pie shall shows differnt types of severity and services of fortigate firewall.Details of attack can be seen in the summary table.How to remove this filter is explained here
Fortigate Firewall MaliciousIP Dashboard
Go to "Dashboards" from the left menu. From the list of in-built dashboards, select this one. It shall open the Dashboard. This dashboard focuses on the fortigate firewall communication with suspicious IP(s) and its traffic status like action,service ,level etc. You can filter and search information and create new ones too. For help with Dashboards, click here
Elements in the Dashboard are explained below :
| Visualization | Description |
| Contribution of Action pie chart | Contribution of differnt types of action like accept/deny on fortigate firewall. |
| Malicious IP wise Action bar chart | X axis : One or more Malicious IP(s) Y axis : MaliciousIP wise Action and it's count. |
| SourceIP wise Hits bar graph | X axis : One or more SourceIP(s) Y axis : SourceIP wise number of hits. |
| DestinationIP wise Hits bar graph | X axis : One or more DestinationIP(s) Y axis : DestinationIP wise number of hits. |
| Contribution of service pie chart | Contribution of differnt types of services like snmp of fortigate firewall. |
| Contribution of level pie chart | Contribution of differnt types of levels like notice of fortigate firewall. |
| Time trend | Trend of login events over time. Useful to identify unusual spikes at a glance. X axis : date & time Y axis : count of events |
| Summary Table | Detailed data with timestamp and count |
A suggestion for useful interaction with this dashboard could be :
- Click on “MaliciousIP” in the "Malicious IP wise Action" bar graph. This gets selected and shows the maliciousIP(s) wise action(s) on fortigate firewall.The next bar shall show source and destination wise hits on fortigate firewall.
- The next pie shall shows differnt types of severity,action ,services and levels of fortigate firewall.Details of MaliciousIP can be seen in the summary table.How to remove this filter is explained here
Fortigate Firewall System Activities Dashboard
Go to "Dashboards" from the left menu. From the list of in-built dashboards, select this one. It shall open the Dashboard. This dashboard summarizes self monitoring system event and also command,action executed by user etc.
You can filter and search information and create new ones too. For help with Dashboards, click here
Elements in the Dashboard are explained below :
| Visualization | Description |
| Contribution of Action pie chart | Contribution of Action performed by particular user on fortigate firewall. |
| User wise Action bar graph | X axis : One or more user(s) Y Axis : Action performed by particular user and it's count. |
| Contribution of Status pie chart | Contribution of differnt types of status of fortigate firewall. |
| Contribution of level pie chart | Contribution of differnt types of levels like notice,warning of fortigate firewall. |
| LogDesc wise Message bar graph | X axis : One or more logdesc Y axis : Logdesc wise message(s) and it's count. |
| Time trend | Trend of login events over time. Useful to identify unusual spikes at a glance. X axis : date & time Y axis : count of events |
| Summary Table | Detailed data with timestamp and count |
Some suggestions for useful interaction with this dashboard could be :
- Click on “User” in the "User wise Action" bar graph. This gets selected and shows the user(s) wise action(s) performed on fortigate firewall.
- The next bar shall show logdesc wise message on fortigate firewall.The next pie shall shows differnt types of status,action and levels of fortigate firewall.
- Details of MaliciousIP can be seen in the summary table.How to remove this filter is explained here
Fortigate Firewall VPN Dashboard
Go to "Dashboards" from the left menu. From the list of in-built dashboards, select this one. It shall open the Dashboard.This dashboard focuses on the fortigate firewall VPN information like VPN name,VPN type etc.
You can filter and search information and create new ones too. For help with Dashboards, click here
Elements in the Dashboard are explained below :
| Visualization | Description |
| Contribution of VPN pie chart | Contribution of differnt VPN of fortigate firewall. |
| Contribution of VPN Type pie chart | Contribution of differnt types VPN type of fortigate firewall. |
| SourceIP wise Hits | X axis : One or more SourceIP(s) Y axis : SourceIP wise number of hits. |
| DestinationIP wise Hits | X axis : One or more DestinationIP(s) Y axis : DestinationIP wise number of hits. |
| Contribution of Service pie chart | Contribution of differnt types of services like snmp,syslog of fortigate firewall. |
| Time trend | Trend of login events over time. Useful to identify unusual spikes at a glance. X axis : date & time Y axis : count of events |
| Summary Table | Detailed data with timestamp and count |
Some suggestions for useful interaction with this dashboard could be :
- Click on “VPN” in the "Contribution of VPN" pie chart. This gets selected and shows the VPN information like VPN name.
- The next bar shall show sourceIP and destinationIP wise hits on fortigate firewall.The next pie shall shows differnt types of VPN types and services of fortigate firewall.
- Details of VPN information can be seen in the summary table.How to remove this filter is explained here
Fortigate Firewall VPNTunnel Dashboard
Go to "Dashboards" from the left menu. From the list of in-built dashboards, select this one. It shall open the Dashboard. This dashboard focuses on the VPN Tunnel information like VPN Tunnel , Status etc.You can filter and search information and create new ones too. For help with Dashboards, click here
Elements in the Dashboard are explained below :
| Visualization | Description |
| Contribution of VPN Tunnel pie chart | Contribution of differnt VPN Tunnel of fortigate firewall. |
| Contribution of Status pie chart | Contribution of status like sucess/failure. |
| Remote IP wise Hits bar graph | X axis : One or more Remote IP(s) Y axis : Remote IP wise number of hits. |
| Local IP wise Hits bar graph | X axis : One or more Local IP(s) Y axis : Local IP wise number of hits. |
| Time trend | Trend of login events over time. Useful to identify unusual spikes at a glance. X axis : date & time Y axis : count of events |
| Summary Table | Detailed data with timestamp and count |
Some suggestions for useful interaction with this dashboard could be :
- Click on “VPN Type” in the "Contribution of VPN Tunnel" bar graph. This gets selected and shows the VPN Tunnel information .
- The next bar shall show RemoteIP and LocalIP wise hits on fortigate firewall.The next pie shall shows different types of status like sucess/failue on fortigate firewall.
- Details of VPN information can be seen in the summary table.How to remove this filter is explained here
Alerts Description
| Alert Name | Description | Suggested Resolution |
| Fortigate firewall successful sweep scan activity by malicious ip | Alert triggered when more than 10 connections happened from same malicious IP and status is deny followed by a successful login status using different Destination IP, within one minute | Bad ip address tries to spray connection requests on one of the popular ports (21,22,53,80,443 etc) on multiple IP addresses with an intention to find which ports are opened on what IP addresses. Typically, scan attempt is the first stage of reconnaissance in the attack life cycle and attacker finds open port on one of ip addresses and is able to establish a connection.
It is important to check the reputation of the external ip address and block the same if necessary. It is also important to verify the sanity of affected internal nodes by checking if any unwarranted system policy change or software configuration/updates have occured during the affected time period. If required, quarantine the affected servers till the time the issues are resolved. |
| Fortigate firewall host scan activity by malicious ip | This is triggered when more than 10 connections happened from same malicious IP using different destination port, within one minute | Bad ip address tries to spray connection requests on multiple popular ports (21,22,53,80,443 etc) targetting one single IP address at a time with an intention to find the open ports on the target IP address. Typically, scan attempt is the first stage of reconnaissance in the attack life cycle.
It is important to check the reputation of the external ip address and block the same if necessary. |
| Fortigate firewall large data sent outside | Alert triggered when large data is send to the external IP Address. | Large amount of data being sent to an external network could be an indication of data exfiltration. Check with the user or process which is responsible for the data being sent out and whether it was done for legitimate business reasons. This could be a false positive. |
| Fortigate firewall critical message reported by firewall management software | This alert is triggered when some operational issue like resource or error. | This message is generated by the firewall itself. It may indicate some operational issue that must be addressed. The admin may refer to firewall manual to take required action (the issue could be related to resources, errors or equivalent). |
| Fortigate firewall sweep scan attack by malicious ip | This alert is triggered when more than 10 connections happened from same malicious IP using different Destination IP's, within one minute | Bad ip addresses tries to spray connection requests on one of the popular ports (21,22,53,80,443 etc) on multiple IP addresses with an intention to find which ports are opened on what IP addresses. Typically, scan attempt is the first stage of reconnaissance in the attack life cycle. It is important to check the reputation of the external ip address and block the same if necessary. |
| Fortigate firewall sweep scan attack | This alert is triggered when more than 10 connections happened from same source IP to various Destination IP's,within one minute. | An attacker tries to spray connection requests on one of the popular ports (21,22,53,80,443 etc) on multiple IP addresses with an intention to find which ports are opened on what IP addresses. Typically, scan attempt is the first stage of reconnaissance in the attack life cycle. Unless it is a known and legitimate IP address performing scan, it is important to block this IP. You may whitelist the known IP addresses (such as designated Vulnerability Scanner, Asset Discovery Tools etc), so as to supress the false positives. |
| Fortigate firewall host scan attack | This is triggered when more than 10 connections happened from same Source and Destination IP using different destination port, within one minute | An attacker tries to spray connection requests on multiple popular ports (21,22,53,80,443 etc) targetting one single IP addresses at a time with an intention to find the open ports on the target IP address. Typically, scan attempt is the first stage of reconnaissance in the attack life cycle. Unless it is a known and legitimate IP address performing the scan, it is important to block this IP. You may whitelist the known IP addresses (such as designated Vulnerability Scanner, Asset Discovery Tools etc), so as to supress the false positives. |
| Fortigate firewall successful host scan activity by malicious ip | Alert triggered when more than 10 connections happened from same malicious IP and status is deny followed by a successful login status using different destination port, within one minute. | Bad ip address tries to spray connection requests on multiple popular ports (21,22,53,80,443 etc) targetting one single IP addresses at a time with an intention to find the open ports on the target IP address. Typically, scan attempt is the first stage of reconnaissance in the attack life cycle and attacker done successful connection on open ports. It is important to check the reputation of the external ip address and block the same if necessary. |
| Fortigate firewall successful host scan activity | This alert is triggered when more than 10 connections happened from same Source and Destination IP and status is deny followed by successful login status using different destination port, within one minute. | Attacker tries to spray connection requests on multiple popular ports (21,22,53,80,443 etc) targetting one single IP addresses at a time with an intention to find the open ports on the target IP address. Typically, scan attempt is the first stage of reconnaissance in the attack life cycle and attacker done successful connection on open ports. It is important to check the reputation of the suspected ip address. |
| Fortigate firewall backdoor traffic detected | This alert is triggered when connection happened using vulnerable Destination ports like 3127,3198,6129,7080,within one minute. | This event indicates that a traffic is generated from internal machine on vulnerable ports(3127,3198,6129,7080). Typically, these ports are used by attacker to exploit vulnerable programs listening on these ports. Check is these ports are open and on what servers. Do you really need these ports opened? |
| Fortigate firewall communication with possible IOC or bad IP | This alert is triggered when suspicious IP is communication with internal IP | KHIKA shares community based threat intelligence (TI) every 24 hours. TI has list of IP addresses with bad reputation. Every bad IP is marked with number of communities reporting it, name of each community and confidence indicating how confident are we about the reputation. This alert is generated when communication with a bad IP is let through. If communication with a bad IP is happening, it must be blocked immediately as it could be a possible attack or data exfiltration. |
| Fortigate firewall communication with suspicious IP | This alert is triggered when sent or receive bytes get exchange with malicious IP. | Communication with a bad IP is happening, it must be blocked immediately as it could be a possible attack or data exfiltration.
You can check the log for this communication by simply searching the malicious IP in the logs. You can also check which internal IP addresses are communicating with this IP address and track the real users behind those internal IP addresses. |
| Fortigate firewall successful sweep scan activity | This alert is triggered when more than 10 connections happened from same Source and Destination IP and status is deny followed by successful login status using different Destination IP, within one minute. | Attacker tries to spray connection requests on one of the popular ports (21,22,53,80,443 etc) on multiple IP addresses with an intention to find which ports are opened on what IP addresses. Typically, scan attempt is the first stage of reconnaissance in the attack life cycle and attacker done successful connection on one of ip addresses. It is important to check the reputation of the suspected ip address. |
