Difference between revisions of "Getting Data into KHIKA"
(→Server monitoring in KHIKA using OSSEC) |
|||
| (11 intermediate revisions by 3 users not shown) | |||
| Line 157: | Line 157: | ||
===<div id="Installing OSSEC Agent for Linux"> Installing OSSEC Agent for Linux </div> === | ===<div id="Installing OSSEC Agent for Linux"> Installing OSSEC Agent for Linux </div> === | ||
| − | Download [ | + | Download [http://bit.ly/TL_OSSEC Linux Ossec Agent from here].<br> |
For Linux Agent, Please check your OS version and select appropriate downloader file.<br> | For Linux Agent, Please check your OS version and select appropriate downloader file.<br> | ||
| − | Version 5: ossec_TL_Agent_5.11.tar.gz<br> | + | Version 5: '''ossec_TL_Agent_5.11.tar.gz'''<br> |
| − | Version 6: ossec_TL_Agent_6.x.tar.gz<br> | + | Version 6: '''ossec_TL_Agent_6.x.tar.gz'''<br> |
| − | Version 7: ossec_TL_Agent.tar.gz<br> | + | Version 7: '''ossec_TL_Agent.tar.gz'''<br> |
Copy the downloaded installer on your Linux server that you wish to monitor using KHIKA and run the installer with "root" credentials on the Server. | Copy the downloaded installer on your Linux server that you wish to monitor using KHIKA and run the installer with "root" credentials on the Server. | ||
| − | Please Note : It is extremely important to install the OSSEC agent with "root" privileges as this agent reads the /var/log/secure logs and some other important files. In order to read it successfully the ossec-agent process must be installed with "root" privileges. | + | Please Note : It is extremely important to install the OSSEC agent with "root" privileges as this agent reads the '''/var/log/secure, /var/log/messages''' logs and some other important files. In order to read it successfully the ossec-agent process must be installed with "root" privileges. |
You will have to run following command as "root" user to install the Ossec Agent :-<br/> | You will have to run following command as "root" user to install the Ossec Agent :-<br/> | ||
Remove / rename ossec directory if already exists on the agent. ie. our Linux server.<br/> | Remove / rename ossec directory if already exists on the agent. ie. our Linux server.<br/> | ||
| − | mv /opt/ossec /opt/ossec_bak | + | '''mv /opt/ossec /opt/ossec_bak''' |
Go to the location where you have copied the Ossec agent installer mentioned above. Extract it using the following command<br/> | Go to the location where you have copied the Ossec agent installer mentioned above. Extract it using the following command<br/> | ||
'''tar –zxvf ossec_TL_Agent.tar.gz''' | '''tar –zxvf ossec_TL_Agent.tar.gz''' | ||
| Line 192: | Line 192: | ||
| − | Download [ | + | Download [http://bit.ly/TL_OSSEC Windows Ossec Agent from here].<br> |
For Windows you will need to select the Windows installer with filename '''ossec-win32-agent.zip'''. After unzip, the installer file name is - ossec-win32-agent.exe. This works for both 32-bit and 64-bit windows servers OS versions. | For Windows you will need to select the Windows installer with filename '''ossec-win32-agent.zip'''. After unzip, the installer file name is - ossec-win32-agent.exe. This works for both 32-bit and 64-bit windows servers OS versions. | ||
| Line 241: | Line 241: | ||
| − | Refer this section only if you have not installed the relevant Application for your data type. (If you have installed KHIKA Application as explained in [[Load KHIKA App|how to load a KHIKA App]], skip this section.) | + | Refer to this section only if you have not installed the relevant Application for your data type. (If you have installed KHIKA Application as explained in [[Load KHIKA App|how to load a KHIKA App]], skip this section.) |
| − | There is a list of | + | There is a list of inbuilt Adaptors in KHIKA, for as much as 200 different data sources and their multiple versions. You can see the entire list of Adaptors at /opt/KHIKA/Apps/Adapters. Here now, in our case we can find Ossec adapter at - '''/opt/KHIKA/Apps/Adapters/OssecArchiveLog'''. |
| − | For | + | For Linux, we need an adaptor by script name '''“TLHookScriptArchiveMasterParser.py”'''. When you add it from the KHIKA gui, you can give it any name you want. |
The steps to configure the adaptor are the same for Windows and Linux. Linux adaptor is used in the example below. | The steps to configure the adaptor are the same for Windows and Linux. Linux adaptor is used in the example below. | ||
Go to Configure from the left panel. Select appropriate workspace from the workspace dropdown. In this case, Linux. Go to Adaptor tab. | Go to Configure from the left panel. Select appropriate workspace from the workspace dropdown. In this case, Linux. Go to Adaptor tab. | ||
| Line 472: | Line 472: | ||
Refer this section only if you have not installed the relevant Application for your data type. (If you have installed KHIKA Application as explained in [[Load KHIKA App]], skip this section.) | Refer this section only if you have not installed the relevant Application for your data type. (If you have installed KHIKA Application as explained in [[Load KHIKA App]], skip this section.) | ||
| − | There is a list of | + | There is a list of inbuilt Adaptors in KHIKA, for as much as 200 different data sources and their multiple versions. You can see the entire list of Adaptors at '''/opt/KHIKA/Apps/Adapters'''. Here now, in our case, we can find Symantec AV adapter at - '''/opt/KHIKA/Apps/Adapters/SymantecAV'''. |
For Symantec AV, we need an adaptor by script name “TL_HookAdaptorSymantecEP.py”. When you add it from the KHIKA gui, you can give it any name you want. | For Symantec AV, we need an adaptor by script name “TL_HookAdaptorSymantecEP.py”. When you add it from the KHIKA gui, you can give it any name you want. | ||
| Line 478: | Line 478: | ||
Add an Adaptor in KHIKA using below steps. | Add an Adaptor in KHIKA using below steps. | ||
| − | Do “+Add Adaptor” in KHIKA by selecting appropriate workspace | + | Do “+Add Adaptor” in KHIKA by selecting an appropriate workspace |
| − | Login to KHIKA web interface, select appropriate workspace and click “Configure” “Adaptor” and then click “+Add Adaptor” | + | Login to KHIKA web interface, select an appropriate workspace and click “Configure” “Adaptor” and then click “+Add Adaptor” |
| Line 548: | Line 548: | ||
| − | [[File: | + | [[File:apply_configuration_antivirus.JPG|700px]] |
</br> | </br> | ||
[https://youtu.be/oKtUvD4x-Gk See Video] | [https://youtu.be/oKtUvD4x-Gk See Video] | ||
| − | |||
=== Verifying syslog data collection === | === Verifying syslog data collection === | ||
| Line 581: | Line 580: | ||
| − | [[KHIKA | + | [[Accessing the KHIKA Gui|Previous]] |
Refer the next section for [[Discover or Search Data in KHIKA|exploring your data in KHIKA]] | Refer the next section for [[Discover or Search Data in KHIKA|exploring your data in KHIKA]] | ||
[[KHIKA User Guide|<div style='text-align: right;'>Back to Index</div>]] | [[KHIKA User Guide|<div style='text-align: right;'>Back to Index</div>]] | ||
Latest revision as of 02:22, 31 March 2020
Contents
- 1 Introduction
- 2 Data Flow and Components in KHIKA
- 3 KHIKA Apps
- 4 Importing an Application
- 5 Exporting an Application
- 6 Server monitoring in KHIKA using OSSEC
- 6.1 Installing OSSEC Agent for Linux
- 6.2 Installing OSSEC Agent for Windows
- 6.3 Configuring OSSEC Adapter in KHIKA
- 6.4 Adding the device in the Adaptor
- 6.5 Extract key from KHIKA OSSEC Server
- 6.6 Insert unique OSSEC key in Linux OSSEC Agent
- 6.7 Insert unique OSSEC key in Windows OSSEC Agent
- 6.8 Reload Configuration
- 6.9 Verifying OSSEC data collection
- 6.10 Troubleshooting
- 7 Monitoring in KHIKA using Syslog forwarding
Introduction
On completing the configuration steps from previous sections, we are ready to take in data from various devices into KHIKA. Network devices like Firewalls, Routers/Switches, Web proxies etc use Syslog protocol most of the times to forward the data to the KHIKA Aggregator. Linux and Windows Servers use OSSEC Agents and it’s Integration with KHIKA to forward the data. Integrating a device into KHIKA can be done in either of the ways and involves some basic steps :
- Pointing the device to be monitored to KHIKA data collector. This can be in different ways (explained separately in sections below for syslog and ossec)
- On the KHIKA end, making the device entry at the adaptor level.
For this step, on the KHIKA end, there are two ways of configuring the adaptor.
- Install an Application – This is the most recommended method to configure. KHIKA ships some standard applications and it is explained in the next section how to install an Application. This step includes adaptor configuration and adaptors don’t have to be added separately if you have installed relevant application
By Installing an application, you not only get an adaptor configured but also the relevant reports, dashboards and real time critical correlation alerts for this data source are configured in just a single click – by just installing the application.
- Configure an adaptor in the right workspace, within the KHIKA data collector. This step is required only when you have not installed an application. For example, in case of any specific web application logs in your organisation etc.
Data Flow and Components in KHIKA
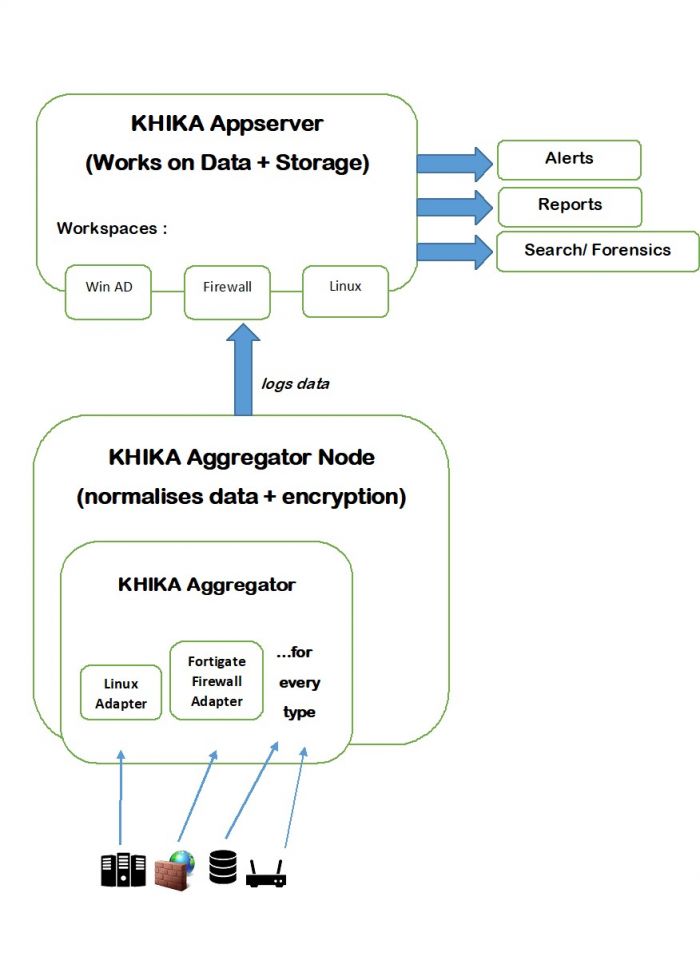
Data is sent from the end node or data source to KHIKA data collector or Aggregator node locally within its network. Inside the Aggregator there are Adaptors, one for each data type. Each Adaptor receives data, parses and normalises it to KHIKA proprietary data format. This is sent to KHIKA application server where it is acted upon by the correlation engine, indexer and storage. This data is stored in the workspace meant for this data type or access. KHIKA creates output in the form of Reports and Dashboards, real time Alerts and Search. Following is a diagram for the same.
There can be multiple aggregator nodes collecting data from different locations and transferring data to a single KHIKA App server.
When we install an Application, as explained in the following section, the relevant adaptor is configured inside the correct aggregator, and the relevant alerts, reports and dashboards are configured. There are different inbuilt applications each for standard data sources.
When we do not install an application, we have to add the relevant adaptor for that data type into its aggregator node. This step has to be done while the correct workspace is selected.
Workspace contains an Aggregator and an Adaptor.
A KHIKA user can have access to one or more workspaces. Before creating workspaces, it is important to think which users will have access to which workspaces. Design your workspaces with a clear view and understanding of the data. As a thumb rule, you must create a separate workspace for the data that needs restricted access. (Example:- If you don’t want your IT team to have access to your HR data, create a separate workspace for your HR data). Create different “User Groups”, one per “Workspace”. While creating the Workspace, carefully assign it to an appropriate “User Group”. Create Users and assign them to one or more “user Group/s” depending on the access requirements.
KHIKA Apps
Go to the Load a KHIKA App section for more.
Importing an Application
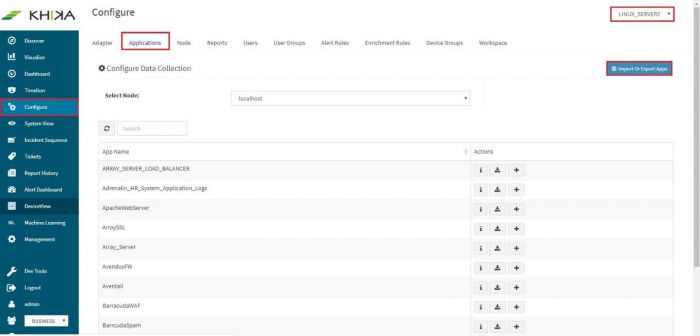
This feature is useful when there are newer KHIKA applications, which are not part of the current build. If there are data sources in your network for which there are newly developed KHIKA applications, KHIKA developers can export the KHIKA application (a .tar.gz file) Once you receive it, you can simply import it in a few easy steps. After importing, you can see it in the Applications list, install the imported application as explained in the section, how to Load KHIKA App. Select Configure from the left panel. Select the appropriate workspace from the workspace dropdown on the top right. Go to the “Application” tab. Click on “Import Or Export Apps”
You will get a pop up as shown :
Click on “Choose App” button. This will open a browser windows to select the application’s exported file from your local machine, where you have saved it.
Select the file and click on “Upload” button. Click on Close button. We get a confirmation message in a pop up, after successful; upload and import of application.
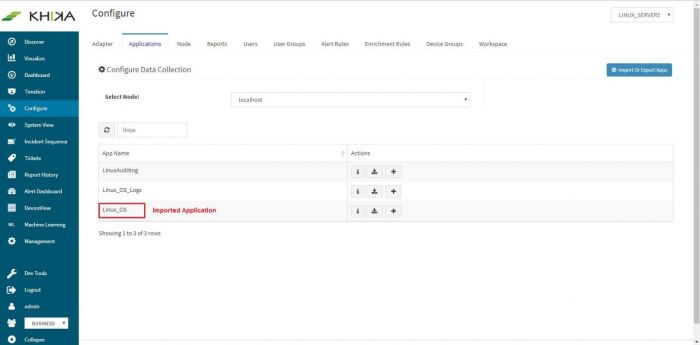
The newly imported application is now visible in the applications list. When we enter “linux” in search, now we see the additional linux application.
Exporting an Application
Select Configure from the left panel. Select the appropriate workspace from the workspace dropdown on the top right. Go to the “Application” tab. Click on “Import Or Export Apps”
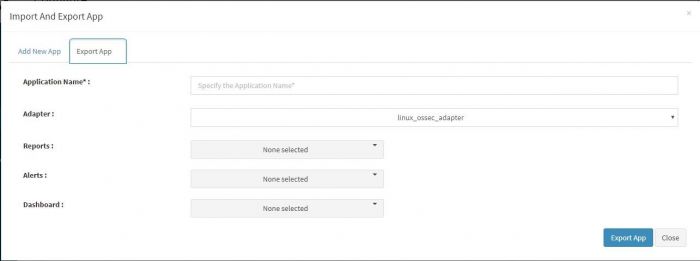
You will get a pop up as shown. Select “Export App” tab on the top.
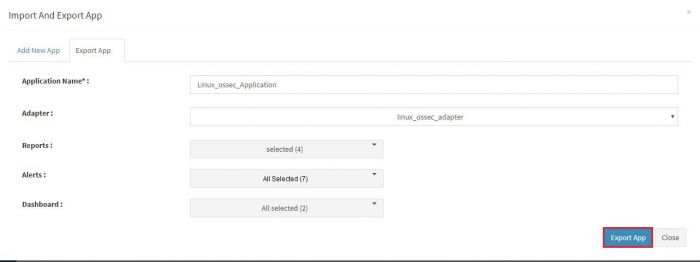
Another pop up appears where we can enter and select details to be exported in the application.
The fields in this pop up are explained in the table below.
| Fields | Description |
|---|---|
| Application Name | Name of the exported application. You have to enter a new name for it. When you import this application, elsewhere it shall get imported with the new name you have given here. |
| Adapter | Select the relevant adaptor from the dropdown for the data type of this application. |
| Reports | The report dropdown has the names of all reports pre configured in this application. You can select which ones to export using checkboxes. Select one or more reports in this dropdown. Only those reports shall be available when this application is imported and installed elsewhere. |
| Alerts | Similar to report dropdown above, select the alerts you wish to export with this app. |
| Dashboard | Similar to report dropdown, select the dashboard names you wish to export. You can select as many dashboards as you wish, however a please note the reports selected in above dropdown. If there are any direct corresponding dashboards for these reports, you might want to select all those dashboards too. |
Click on “Export App” button.
Confirmation message appears on successful export.
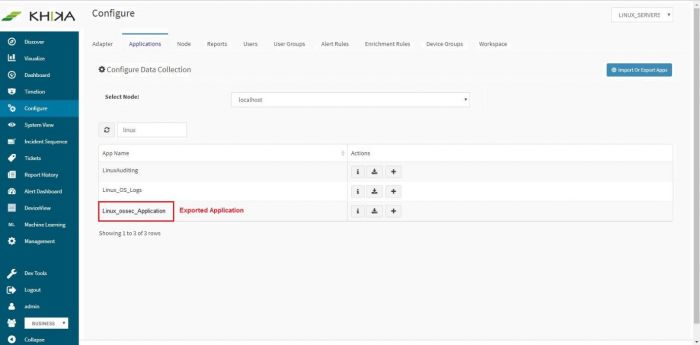
This application, ready to be exported is now visible in the applications list.
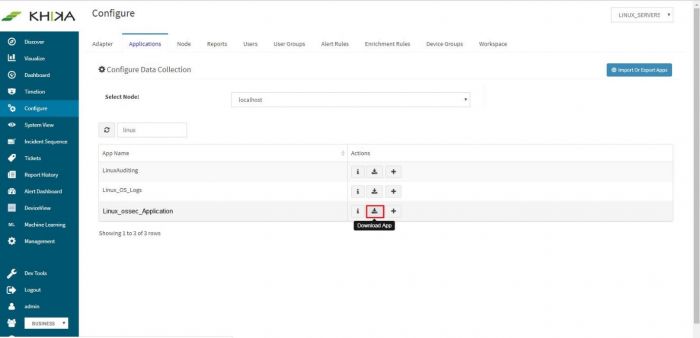
Click on the download icon next to this application,
Now from our example screenshot, this is downloaded as “Linux_ossec_Application.tar.gz” on your local machine.
Server monitoring in KHIKA using OSSEC
This section is relevant if you are going to monitor your Windows or Linux servers using KHIKA App for Windows or Linux. KHIKA relies on OSSEC integration for monitoring Windows and Linux servers. Please read “Why KHIKA integrates closely with OSSEC?” in the About OSSEC section to know more about OSSEC and KHIKA Integration. There are 2 components in OSSEC monitoring.
- OSSEC Agent – Installed on each Linux / Windows server which we wish to pull data from.
- OSSEC Server – Present on KHIKA Data Aggregator or collector VM. If KHIKA is installed in your environment using the .ova KHIKA virtual appliance, then OSSEC server is already installed. You do not need additional steps for it.
In case you are not using the .ova file provided by KHIKA, OSSEC server should be separately installed. The installer is located in /opt/KHIKA/UTILS/OSSEC directory. The filename is “ossec_TL_Server.tar.gz”. In this case, the steps to install OSSEC Server on a Linux Machine are mentioned here.
The OSSEC agent and server are paired to each other using a unique key. Once they start talking to each other, Ossec agent then relays data to the Ossec server real time. Therefore the main steps to start getting data from a device are :
- Install Ossec agent on the Linux / Windows servers
- Configure OSSEC adaptor in KHIKA
- Add the Linux / Windows server details in KHIKA for respective Adaptor
- Extract a unique key for this device from KHIKA Adaptor
- Insert this key in the Ossec agent.
- Reload Configuration on Aggregator
Each of these steps is explained in detail in the further sections.
Installing OSSEC Agent for Linux
Download Linux Ossec Agent from here.
For Linux Agent, Please check your OS version and select appropriate downloader file.
Version 5: ossec_TL_Agent_5.11.tar.gz
Version 6: ossec_TL_Agent_6.x.tar.gz
Version 7: ossec_TL_Agent.tar.gz
Copy the downloaded installer on your Linux server that you wish to monitor using KHIKA and run the installer with "root" credentials on the Server.
Please Note : It is extremely important to install the OSSEC agent with "root" privileges as this agent reads the /var/log/secure, /var/log/messages logs and some other important files. In order to read it successfully the ossec-agent process must be installed with "root" privileges.
You will have to run following command as "root" user to install the Ossec Agent :-
Remove / rename ossec directory if already exists on the agent. ie. our Linux server.
mv /opt/ossec /opt/ossec_bak
Go to the location where you have copied the Ossec agent installer mentioned above. Extract it using the following command
tar –zxvf ossec_TL_Agent.tar.gz
Then go to that directory using the command: cd ossec_TL_Agent
You shall see a script by the name install.sh
Then Run following command.
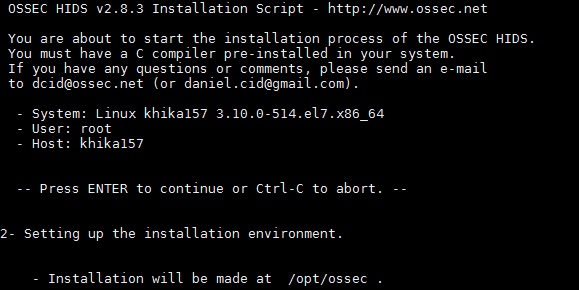
"./install.sh"
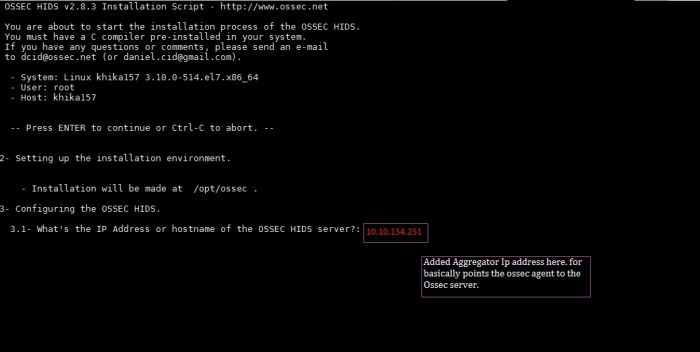
Now, add KHIKA Data Aggregator IP address (OSSEC server IP address) to point the OSSEC agent to the OSSEC server.
NOTE :- You will have to repeat these steps on all the Linux Servers that you wish to monitor using KHIKA.
Installing OSSEC Agent for Windows
Download Windows Ossec Agent from here.
For Windows you will need to select the Windows installer with filename ossec-win32-agent.zip. After unzip, the installer file name is - ossec-win32-agent.exe. This works for both 32-bit and 64-bit windows servers OS versions.
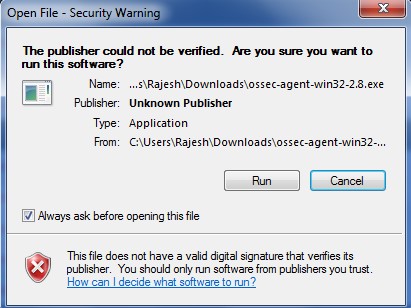
Copy the downloaded installer on your Windows server (using winscp or your favourite scp client) and run installer with local "Admin" on the Server. Please Note : It is extremely important to install the OSSEC agent with admin privileges as this agent reads the security logs and in order to read it successfully, it has to be the local Admin. Select the installer file and Press "Run"
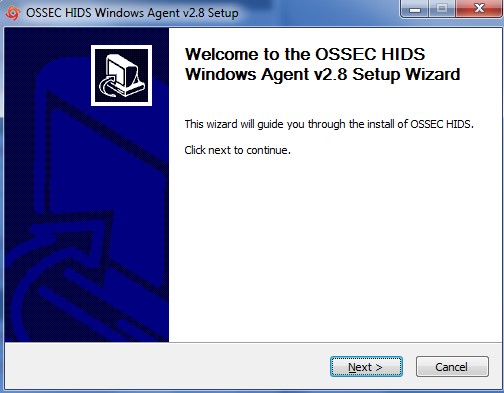
Click Next
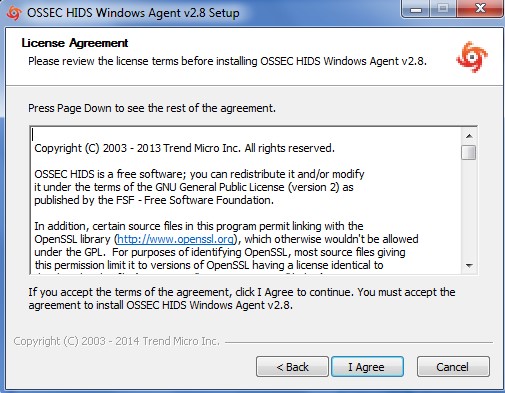
Select "I Agree" and proceed
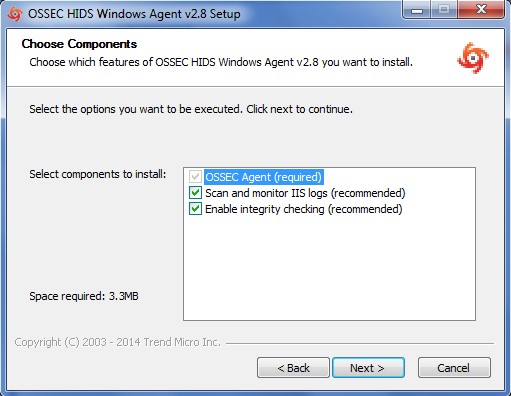
Keep the default selection in the next window and click Next
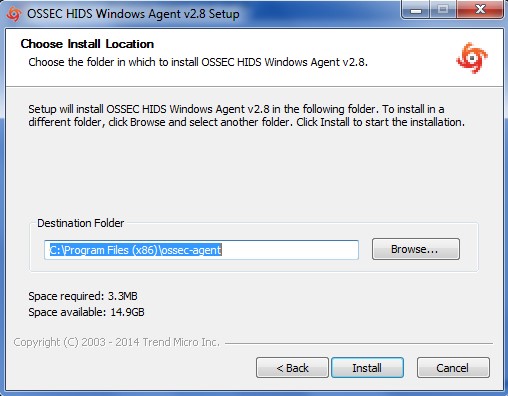
Enter the location to install the OSSEC agent on the local drive and let the installation complete
After the installation is complete, verify that the OSSEC HIDS Service is successfully installed on your Windows Server. (Go to your Service Control Panel and check for OSSEC HIDS Service)
NOTE :- You will have to repeat these steps on all the Windows Servers that you wish to monitor using KHIKA.
Configuring OSSEC Adapter in KHIKA
Refer to this section only if you have not installed the relevant Application for your data type. (If you have installed KHIKA Application as explained in how to load a KHIKA App, skip this section.)
There is a list of inbuilt Adaptors in KHIKA, for as much as 200 different data sources and their multiple versions. You can see the entire list of Adaptors at /opt/KHIKA/Apps/Adapters. Here now, in our case we can find Ossec adapter at - /opt/KHIKA/Apps/Adapters/OssecArchiveLog.
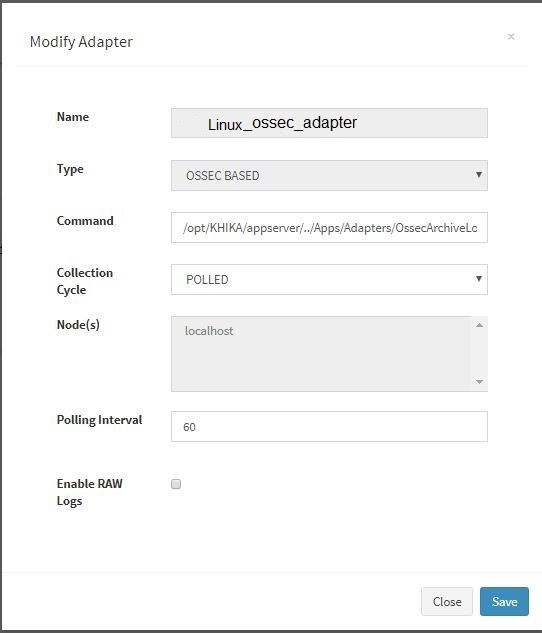
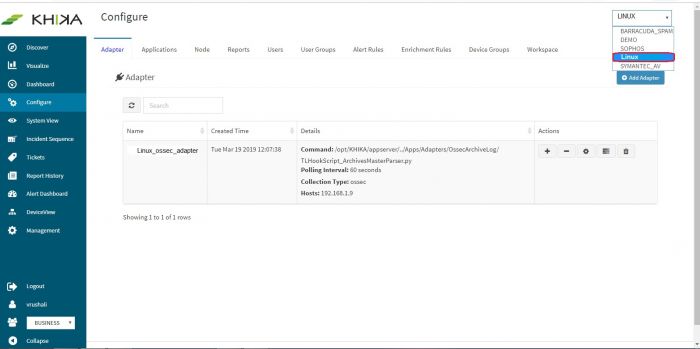
For Linux, we need an adaptor by script name “TLHookScriptArchiveMasterParser.py”. When you add it from the KHIKA gui, you can give it any name you want. The steps to configure the adaptor are the same for Windows and Linux. Linux adaptor is used in the example below. Go to Configure from the left panel. Select appropriate workspace from the workspace dropdown. In this case, Linux. Go to Adaptor tab. Click on “Add Adaptor” button. Following pop up appears. Enter adaptor details as mentioned.
The fields in the pop up are explained
| Fields | Description |
|---|---|
| Name | Logical name of the Adapter. Give any alphanumeric name without white spaces to your Adapter. |
| Type | Type of Adaptor. Select Ossec Based – from this dropdown. |
| Command | The path to the Adapter script (the script/program must be present on the specified path with appropriate permission on the selected Data Aggregator). Default path for OSSEC adaptor is /opt/KHIKA/Apps/Adapters/OssecArchiveLog/TLHookScript_ArchivesMasterParser.py |
| Collection Cycle | Select “POLLED” from the dropdown. |
| Node | The Data Aggregator or collector node, where the adapter is supposed to run at a periodic polling interval. |
| Polling Interval | Specify in seconds. The script will execute itself after the specified polling interval, check for new data each time, and convert it to the KHIKA format according to the logic coded in it. |
| Enable Raw Logs | If you select this checkbox, KHIKA will store the “raw” message in KHIKA data repository (in addition to all other key-value pairs) with key as “raw_log”. Note that this increases the storage requirements by nearly 50% and hence you should select this checkbox only if you need entire raw message. |
After entering details, click on Save. A success message pop up appears and the adaptor is seen in the adaptor tab now :
Adding the device in the Adaptor
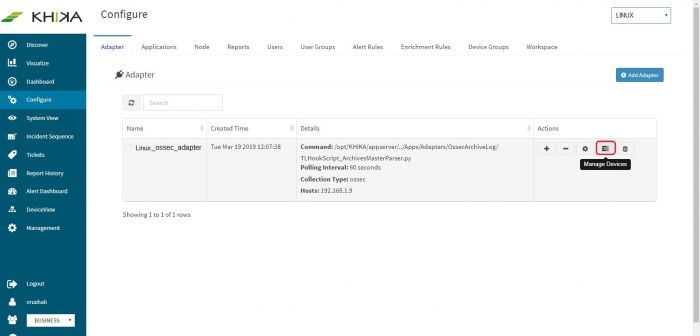
Next to this adaptor, click on the “Manage Devices” icon.
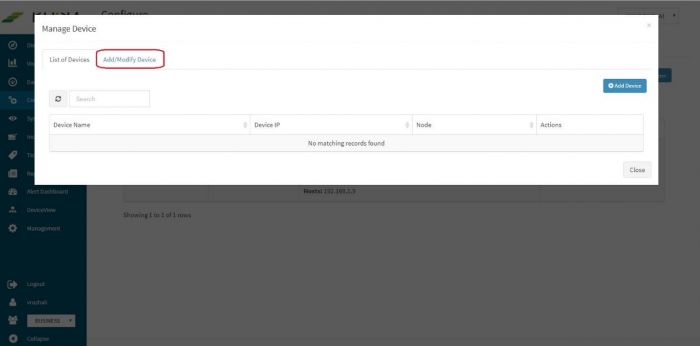
Pop up appears for device details
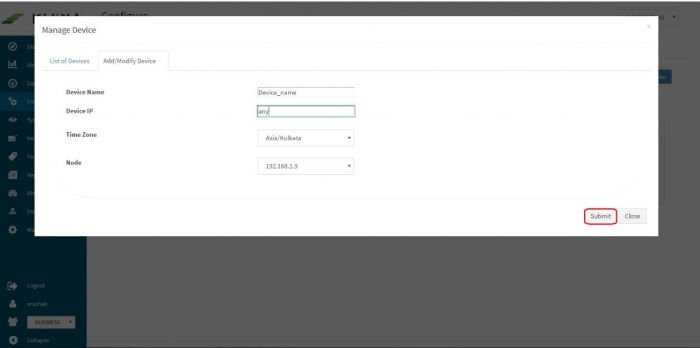
Click on “Add / Modify Device” tab. Another pop up appears for device details.
Enter the expected device name. Also, in the field for IP address, enter “any”.
Please note : Always enter the IP Address as “any”. This is a safe and sure option to establish a connection with the server where we are suggesting ossec agent to use “any” of its configured IPs to be used to connect with the OSSEC Server. The device may have multiple NIC cards/IP addresses and unless we are sure of what IP will be used for connection, the connect will fail. Hence, use “any”
Select appropriate time zone of this device. In the “Node” field dropdown, select the name of the Aggregator or local data collector for this device.
Click on Submit. We get a success message and device is added successfully to this adaptor.
Finally, go to Workspace tab and click on “Apply Configuration” icon.
Extract key from KHIKA OSSEC Server
Now the expected Linux server is added in the required adaptor. To see this device entry, click on “Manage Devices” icon next to the adaptor .
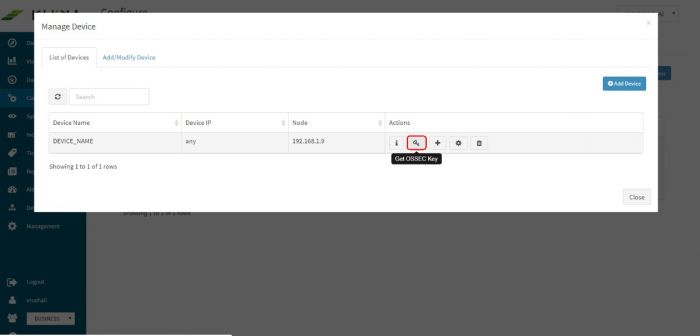
A pop up with device details of the adaptor appears. Select “List of Devices” tab.
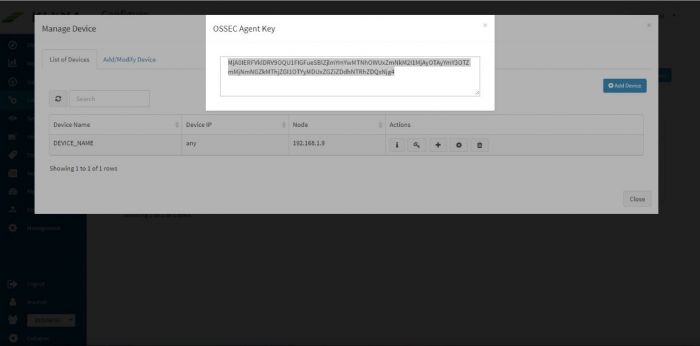
Click on the “Get OSSEC Key” icon next to this device.
This is the unique key for this device created by the OSSEC server. Paste this key in the Ossec agent which is installed on this Linux server.
The above sections for configuring OSSEC adapter in KHIKA, adding device in adapter, extracting key from OSSEC server are same for Windows and Linux.
Insert unique OSSEC key in Linux OSSEC Agent
Perform following simple steps on the Linux Agent:
- Login as "root" on the agent server
- Please note that firewall between the ossec agent and ossec server must be open for UDP protocol and 1514 port.
- In the OSSEC Agent installation directory, run 'manage-agents' script. Use the command /opt/ossec/bin/manage_agents
- You'll be presented with these options
Select "i" to import the key (which we created in above section, on the Ossec server)
- Copy and paste the key generated on the server
- Restart the agent using command /opt/ossec/bin/ossec-control restart
Insert unique OSSEC key in Windows OSSEC Agent
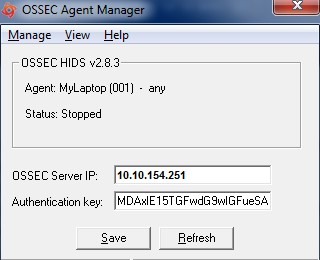
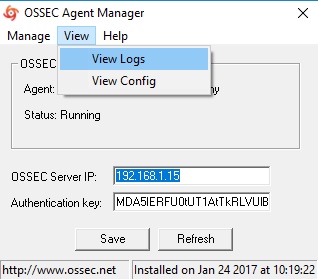
Perform following simple steps on the Windows Agent In the OSSEC Agent installation directory, run win32ui.exe to open-up a window as shown below – Run as Administrator.
Enter the IP Address of the KHIKA data aggregator or collector node and paste the copied key (generated by OSSEC server in the section 3.2.5 above) in the box against "Authentication key" and click Save.
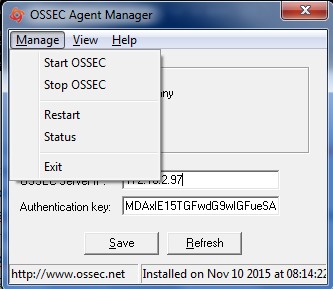
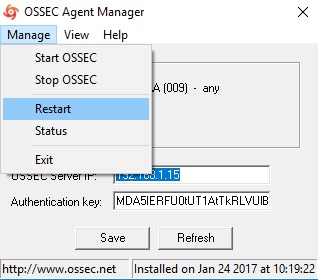
From "Manage" drop-down, select "Restart" to restart the OSSEC Agent. Click on the Refresh button in the bottom next to Save.
Wait for a few minutes. Repeat above steps for all the agents to be added.
Reload Configuration
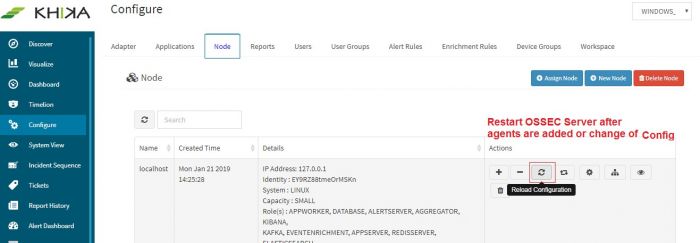
Login into the KHIKA portal. Go to Configure. Select workspace eg. WINDOWS_SERVERS. Go to Node Tab. There might be one or more nodes added here. Next to the node where this device is added, click on Reload Configuration icon.
This step restarts OSSEC Server.
Wait for a few minutes for server to restart.
Verifying OSSEC data collection
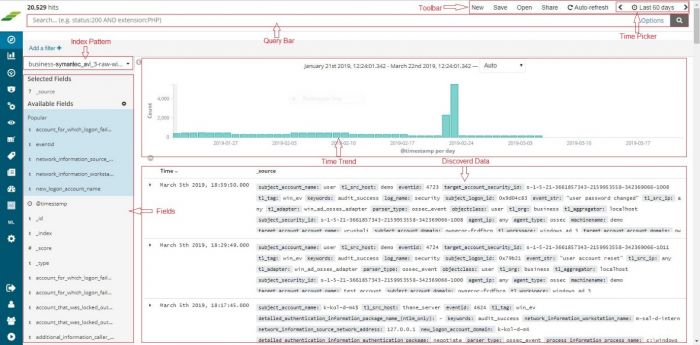
Once the device is added successfully, we can check the data for this device on Discover screen. Select the appropriate index for the same.
In this screen enter search string in lower case –
tl_src_host : name_of_the_device_added_in_lower_case
Troubleshooting
If the data is not seen, wait for some time. If data still does no appear in the Discover tab, perform following steps.
For Linux
- Go to Agent Device
- Go to ossec agent installation log directory (i.e. "/opt/ossec/logs")
- Search for IP of the OSSEC Server in the log (i.e. ossec.log) and check if agent is connected to the server on its IP address.
- If agent is not connected, you can restart the agent following command as "root" user.
/opt/ossec/bin/ossec-control restart
- Check the log again for connection or any errors.
- Make sure the firewall between agent device and OSSEC Server is opened for port UDP/1514
- Go to Discover page and search again to see if the data is coming.
- If the data still does not appear in the search query, contact KHIKA Support.
For Windows
- Go to Agent Device
- Go to ossec agent installation log directory
- Search for IP of the OSSEC Server in the log and check if agent is connected to the server on its IP address.
- If agent is not connected, you can restart the agent, using the option as shown below.
- Check the log again for connection or any errors.
- Make sure the firewall between agent device and OSSEC Server is opened for port UDP/1514
- Go to Discover page and search again to see if the data is coming.
- If the data still does not appear in the search query, contact KHIKA Support.
Monitoring in KHIKA using Syslog forwarding
Most of the network devices, such as firewalls, switches, routers, web proxies etc send the traffic and user activity related information in the form of logs over syslog protocol. Some applications such as Oracle database server, Symantec antivirus server, EMC SAN Storage etc also support syslog protocol these days as syslog is very efficient and simple to integrate with. KHIKA Data Aggregator is pre-configured with syslog services on port 514. There are two parts to start getting data in KHIKA
- Enabling Syslog forwarding on the device
- Adding adaptor and device details in KHIKA
Enabling syslog forwarding on the device
You must configure the network device (or the end node) to send its logs to KHIKA Data Aggregator by providing IP address of Data Aggregator and port 514 so that the device can send its logs to KHIKA syslog service. (Please refer the documentation of individual device/vendor/OEM to understand how to configure remote syslogging for the device. Many vendors support web based configuration these days and some vendors support command based configurations)
Configuring Syslog based KHIKA Adaptor
Refer this section only if you have not installed the relevant Application for your data type. (If you have installed KHIKA Application as explained in Load KHIKA App, skip this section.)
There is a list of inbuilt Adaptors in KHIKA, for as much as 200 different data sources and their multiple versions. You can see the entire list of Adaptors at /opt/KHIKA/Apps/Adapters. Here now, in our case, we can find Symantec AV adapter at - /opt/KHIKA/Apps/Adapters/SymantecAV.
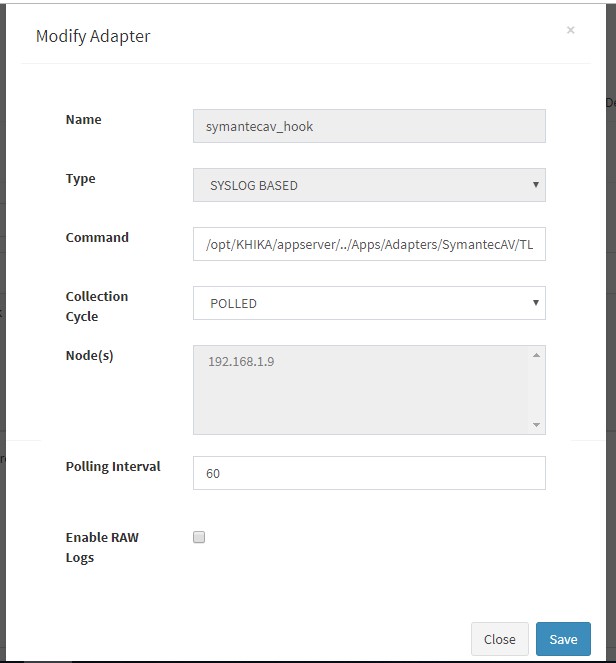
For Symantec AV, we need an adaptor by script name “TL_HookAdaptorSymantecEP.py”. When you add it from the KHIKA gui, you can give it any name you want. KHIKA ships adapters for many popular network devices that send the logs and other useful information via syslog protocol. Most of the Adapters are written in “python” scripting language. To locate the Adapter, go to /opt/KHIKA/Apps/Adapters directory on KHIKA Data Aggregator and do “ls” to check the available Adaptors shipped with KHIKA. (Please write to us on support@khika.com if you do not find the adaptor of your interest)
Add an Adaptor in KHIKA using below steps. Do “+Add Adaptor” in KHIKA by selecting an appropriate workspace Login to KHIKA web interface, select an appropriate workspace and click “Configure” “Adaptor” and then click “+Add Adaptor”
The fields in the pop up are explained
| Fields | Description |
|---|---|
| Name | Logical name of the Adapter. Give any alphanumeric name without white spaces to your Adapter (SimpleFileReader). |
| Type | Type of Adaptor. Select Syslog Based – from this dropdown. |
| Command | The path to the Adapter script (the script/program must be present on the specified path with appropriate permission on the selected Data Aggregator). |
| Collection Cycle | Select “POLLED” from the dropdown. |
| Node | The Data Aggregator or collector node, where the adapter is supposed to run at a periodic polling interval. |
| Polling Interval | Specify in seconds. The script will execute itself after the specified polling interval, check for new data each time, and convert it to the KHIKA format according to the logic coded in it. |
| Enable Raw Logs | If you select this checkbox, KHIKA will store the “raw” message in KHIKA data repository (in addition to all other key-value pairs) with key as “raw_log”. Note that this increases the storage requirements by nearly 50% and hence you should select this checkbox only if you need entire raw message. |
Click Save to add the Adaptor to workspace. Newly added adaptor can be seen in the Adaptor tab, when the respective workspace is selected in workspace dropdown.
Each KHIKA Adaptor for network devices has a python script and a configuration csv file in the directory. (We encourage you to open the python script and try to understand it’s working.) The name of the directory clearly indicates the network device type/make. It is populated when you add a device to this adaptor using the manage devices icon. (We shall add a device in the section below.)
Adding device details in the Adaptor
Go to Configure from the left pane. Select the respective workspace from the workspace dropdown. Select adaptor tab. The newly added adaptor is seen here now. Click on the “Manage Devices” icon next to this adaptor.
A pop up opens for device details of this adaptor. There are tabs on top. Click on the “Add / Modify Device” tab
A pop up appears with a form for the expected device’s details
Enter the expected device name and IP address. Select appropriate time zone of this device. In the “Node” field dropdown, select the name of the Aggregator or local data collector for this device.
Click on Submit. We get success message as shown :
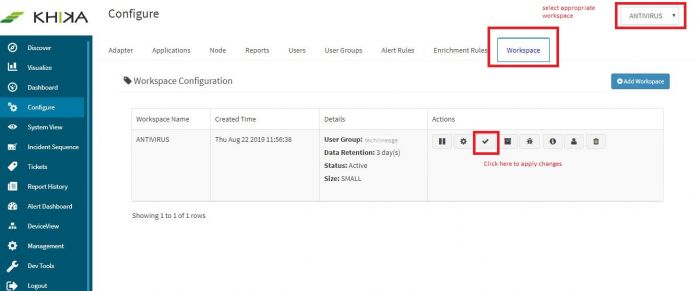
Go to “Workspace” tab and click Apply Configuration button to apply the changes.
Verifying syslog data collection
After the device is configured to send the data to KHIKA Data Aggregator, you must verify if logs are being collected successfully. The first step is to configure the device to send its data to KHIKA Data Aggregator using syslog protocol. As soon as you enable the data forwarding on the device, check if syslogs are being received properly on the Aggregator. You will need to note the IP address of the device sending the data and ssh credentials of your KHIKA Data Aggregator
- Login to KHIKA Data Aggregator
- Go to directory /opt/remotesyslog
- Do “ls -ltr” in this directory and check the directory with IP address of the device in question. KHIKA Data Aggregator creates separate directory for each device with IP address as the name of the directory.
- Enter the directory (cd /opt/remotesyslog/ip_address_of_device) and do “ls -ltr” to check the files. By now, KHIKA’s syslog must have created a file with current date. The file name format is YYYY-MM-DD-HH.log
Sample output of the file names is shown below
After verifying if logs are coming to KHIKA Data Aggregator, it is the time to check if logs are being received in KHIKA and they are searchable in theGUI interface. Also on the GUI, we can check the data for this device type on Discover screen. Select the appropriate index for the same. (Index patterns in Discover screen are explained in previous section)
Enter search string tl_src_host : “ip_of_device” to ensure that the data is appearing in the GUI.
Refer the next section for exploring your data in KHIKA
