Difference between revisions of "KHIKA App for Symantec Antivirus"
Onkar pawar (talk | contribs) (→Enabling Syslog forwarding on the device) |
(→Symantec Antivirus SEP Cant Take Action Dashboard) |
||
| (38 intermediate revisions by 2 users not shown) | |||
| Line 1: | Line 1: | ||
== Introduction == | == Introduction == | ||
| − | Antivirus | + | Antivirus forms an important part of any organisations’ network and hence monitoring your Antivirus is imperative. Symantec Antivirus sends malware related information in the form of logs over syslog protocol. Syslog is very efficient and simple to integrate with. KHIKA Data Aggregator is pre-configured with syslog services on port 514. |
The key parts to get here are : | The key parts to get here are : | ||
#Enabling Syslog forwarding on the device | #Enabling Syslog forwarding on the device | ||
| − | # | + | #Installing the KHIKA App for Symantec Antivirus |
#Get data from your Symantec Antivirus into KHIKA Aggregator | #Get data from your Symantec Antivirus into KHIKA Aggregator | ||
| Line 14: | Line 14: | ||
3. Click the local site or remote site that you want to export log data from.<br/> | 3. Click the local site or remote site that you want to export log data from.<br/> | ||
4. Click Configure External Logging.<br/> | 4. Click Configure External Logging.<br/> | ||
| − | 5. On the General tab, in the Update Frequency list box, select how often to send the log data to the file. (You can say 30 seconds here) | + | 5. On the General tab, in the Update Frequency list box, select how often to send the log data to the file. (You can say 30 seconds here)<br/> |
6. In the Master Logging Server list box, select the management server to send the logs to.<br/> | 6. In the Master Logging Server list box, select the management server to send the logs to.<br/> | ||
| − | 7. | + | 7. Use SQL Server and connect multiple management servers to the database, specify only one server as the Master Logging Server.<br/> |
8. Check Enable Transmission of Logs to a SYSLOG Server.<br/> | 8. Check Enable Transmission of Logs to a SYSLOG Server.<br/> | ||
9. Provide the following information: (NOTE: Firewall port 514 must be opened for syslog server to receive the messages) | 9. Provide the following information: (NOTE: Firewall port 514 must be opened for syslog server to receive the messages) | ||
SYSLOG Server – Specify the IP address or domain name of the KHIKA Virtual Appliance that embeds SYSLOG server that will receive the log data. | SYSLOG Server – Specify the IP address or domain name of the KHIKA Virtual Appliance that embeds SYSLOG server that will receive the log data. | ||
Destination Port & Protocol - Specify the protocol as ‘UDP’ and port as ‘514’ | Destination Port & Protocol - Specify the protocol as ‘UDP’ and port as ‘514’ | ||
| − | Log Facility – Specify the log facility as 4<br/> | + | Log Facility – Specify the log facility as - 4<br/> |
10. On the Log Filter tab, check which logs to export. (Select ALL the possible logs here)<br/> | 10. On the Log Filter tab, check which logs to export. (Select ALL the possible logs here)<br/> | ||
11. Click OK.<br/> | 11. Click OK.<br/> | ||
| Line 27: | Line 27: | ||
| − | [[File: | + | [[File:Symantecsyslog1.jpg|700px]] |
| + | |||
| + | |||
| + | [[File:Symantecsyslog2.jpg|700px]] | ||
| + | |||
| + | |||
| + | [[File:Symantecsyslog3.jpg|700px]] | ||
| + | |||
| + | == Verifying SYSLOG data collection == | ||
| + | |||
| + | After you enable the syslog forwarding on the end device, you must verify if the logs are being really received by KHIKA Data Aggregator. Please refer [[Getting Data into KHIKA#Verifying syslog data collection|here]] to understand how to verify syslogs on KHIKA Data Aggregator. | ||
== How to Install the KHIKA App for Symantec Antivirus ? == | == How to Install the KHIKA App for Symantec Antivirus ? == | ||
| Line 35: | Line 45: | ||
This section explains how to pick and install the KHIKA application for Symantec Antivirus - Symantec Antivirus. Installing the application shall put together and activate the adapter (parser) that can handle Symantec Antivirus data format, the dashboards and the alert rules preconfigured. | This section explains how to pick and install the KHIKA application for Symantec Antivirus - Symantec Antivirus. Installing the application shall put together and activate the adapter (parser) that can handle Symantec Antivirus data format, the dashboards and the alert rules preconfigured. | ||
| − | [[ | + | Go to “Applications” tab in the “Configure” menu. |
| + | |||
| + | [[File:syamntec_application_tab.JPG|700px]] | ||
| + | |||
| + | Check whether the appropriate Workspace is selected. | ||
| + | Note: Application is always loaded in a Workspace. Read the section on Workspaces to know more about KHIKA Workspaces. | ||
| + | Also select your KHIKA aggregator name in the Node dropdown. | ||
| + | This is to ensure that we are collecting data from the desired source and into the correct workspace which is ready with the configured application and components. | ||
| + | |||
| + | [[File:syamntec_application_tab2.JPG|700px]] | ||
| + | |||
| + | Click on the “+” button. A pop up appears. | ||
| + | |||
| + | [[File:symantec_install_application.JPG|700px]] | ||
| + | |||
| + | Users can now select the contents of the application required. For example, on the dropdown for “Reports”, click to expand it. List of all reports can be seen. User can individually select the reports required by checking on the checkbox next to each. Alternatively, check on “Select All” option to get all of them. | ||
| + | Similarly you can select content from Alerts and Dashboards. | ||
| + | |||
| + | Visit the sections on [[KHIKA Reports| KHIKA Reports]], [[KHIKA Dashboards| KHIKA Dashboards]], [[KHIKA Alerts & Correlations| KHIKA Alerts & Correlations]] to know more about these topics. | ||
| − | + | Click “OK” to proceed with the installation of the selected Application. | |
| + | After successful installation, following status should be displayed : | ||
| − | + | [[File:Symantec_app_installation.JPG|700px]] | |
| − | |||
| − | + | This simple procedure to install a KHIKA App, automatically configures the Adapter (required for parsing the data from raw syslogs), calculated KHIKA reports on raw data, Visualizations, Dashboards and Alerts – all in one click. | |
== Adding the device in the Adaptor == | == Adding the device in the Adaptor == | ||
| − | [[Getting Data into KHIKA#Adding device details in the Adaptor|Adding device in the Adaptor]] | + | After syslogs are enabled on the device and the App is installed in KHIKA, it is the time to add the device to the this App (in Adapter section of KHIKA Web GUI). Please refer [[Getting Data into KHIKA#Adding device details in the Adaptor|here]] to know [[Getting Data into KHIKA#Adding device details in the Adaptor|how to add the device to an App]]. |
| + | |||
| + | After making these configuration changes, we must apply these changes to the Workspace. Go to Configure, select the Workspace and in Workspace tab of configure menu press the Apply button as shown in the screenshot below. | ||
| + | |||
| + | [[File:symantec_apply_configuration.JPG|800px]] | ||
| + | |||
| − | + | Wait for a few minutes for changes to apply and data to arrive in kHIKA. With all these steps, we should now expect the data to arrive in KHIKA. Lets discover some live data in KHIKA. | |
| − | |||
== How to check the output of KHIKA Symantec Antivirus App ? == | == How to check the output of KHIKA Symantec Antivirus App ? == | ||
| + | |||
| + | ===Discovering the logs of Syamntec Antrivirus=== | ||
| + | |||
| + | After doing all the steps given above, we should start receiving live data into KHIKA. Go to "Discover" section in KHIKA GUI and select the index with name "*raw-symantec_antivirus*". Note that the index has a prefix of the customer name and workspace name. After selecting this index, you should see the live data coming in. Spend some time understanding this data and the fields of the data. | ||
=== Symantec Antivirus Downloaded Content Update Failed Dashboard=== | === Symantec Antivirus Downloaded Content Update Failed Dashboard=== | ||
| − | Go to "Dashboards" from the left menu. From the list of in-built dashboards, select this one. It shall open the Dashboard. This dashboard gives information about | + | Go to "Dashboards" from the left menu. From the list of in-built dashboards, select this one. It shall open the Dashboard. This dashboard gives information about which computer downloaded content successfully but updates have failed. Details like Server Name, Computer Name, source of download is shown in an analytical fashion. |
| − | You can filter and search information | + | You can filter and search information. For help with Dashboards, click [[KHIKA Dashboards|here]] |
==== Elements in the Dashboard are explained below : ==== | ==== Elements in the Dashboard are explained below : ==== | ||
| Line 89: | Line 125: | ||
==== Suggestion for useful interaction with this dashboard could be : ==== | ==== Suggestion for useful interaction with this dashboard could be : ==== | ||
| − | Click on and select a particular Computer from Contribution of Computer pie chart. The rest of the | + | Click on and select a particular Computer from Contribution of Computer pie chart. The rest of the visualizations, reflect for all servers, server from which downloaded etc with respect to selected Computer. |
=== Symantec Antivirus Virus Found Dashboard === | === Symantec Antivirus Virus Found Dashboard === | ||
| − | Go to "Dashboards" from the left menu. From the list of in-built dashboards, select this one. It shall open the Dashboard. | + | Go to "Dashboards" from the left menu. From the list of in-built dashboards, select this one. It shall open the Dashboard. This gives information about any Virus found and its details like which machine, which user and what whas the action taken etc. |
| − | You can filter and search information | + | You can filter and search information. For help with Dashboards, click [[KHIKA Dashboards|here]] |
==== Elements in the Dashboard are explained below : ==== | ==== Elements in the Dashboard are explained below : ==== | ||
| Line 132: | Line 168: | ||
|} | |} | ||
| − | ==== | + | ==== Suggestions for useful interaction with this dashboard could be : ==== |
| − | #Click on and select a particular computer from contribution of Computer | + | #Click on and select a particular computer from contribution of Computer Names pie. The rest of the visualization reflects all users, actions, risks etc with respect to the selected computer. |
| − | #For further granular detection click on and select particular action in Contribution of Actual Action pie chart ,now rest of the | + | #For further granular detection click on and select particular action in Contribution of Actual Action pie chart ,now rest of the visualizations will reflect accordingly. In Summary table we can see all events for this particular computer name and action which is the Risk Name, Server IP Address etc. |
=== Symantec Antivirus Malware Information Dashboard === | === Symantec Antivirus Malware Information Dashboard === | ||
| − | Go to "Dashboards" from the left menu. From the list of in-built dashboards, select this one. It shall open the Dashboard. This dashboard gives summary of which malware's found and its daily count.Details like which is the Risk Name, Risk Count ,Category Type etc is shown in | + | Go to "Dashboards" from the left menu. From the list of in-built dashboards, select this one. It shall open the Dashboard. This dashboard gives summary of which malware's found and its daily count.Details like which is the Risk Name, Risk Count ,Category Type etc is shown in analytical fashion. |
| − | You can filter and search information | + | You can filter and search information. For help with Dashboards, click [[KHIKA Dashboards|here]] |
==== Elements in the Dashboard are explained below : ==== | ==== Elements in the Dashboard are explained below : ==== | ||
| Line 152: | Line 188: | ||
|'''Description''' | |'''Description''' | ||
|- | |- | ||
| − | |Contribution of Risk | + | |Contribution of Risk Names |
| − | |Contribution of All Risk | + | |Contribution of All Risk Names |
|- | |- | ||
|Contribution of Category Type | |Contribution of Category Type | ||
| Line 160: | Line 196: | ||
|Category Type wise Risk Name count | |Category Type wise Risk Name count | ||
|X axis : All category Type in Malware events<br/> | |X axis : All category Type in Malware events<br/> | ||
| − | Y Axis : Category Type wise Risk Name and | + | Y Axis : Category Type wise Risk Name and its event count |
|- | |- | ||
|Risk Name wise Count | |Risk Name wise Count | ||
| Line 173: | Line 209: | ||
|} | |} | ||
| − | |||
==== Some suggestions for useful interaction with this dashboard could be : ==== | ==== Some suggestions for useful interaction with this dashboard could be : ==== | ||
| Line 181: | Line 216: | ||
=== Symantec Antivirus Scan Complete with Risk Dashboard === | === Symantec Antivirus Scan Complete with Risk Dashboard === | ||
| − | Go to "Dashboards" from the left menu. From the list of in-built dashboards, select this one. It shall open the Dashboard. This report | + | Go to "Dashboards" from the left menu. From the list of in-built dashboards, select this one. It shall open the Dashboard. This report shows details of each computer on which antivirus scan was done and its details, risks found in the scan and how many risks were omitted. |
You can filter and search information and create new ones too. For help with Dashboards, click [[KHIKA Dashboards|here]] | You can filter and search information and create new ones too. For help with Dashboards, click [[KHIKA Dashboards|here]] | ||
| Line 218: | Line 253: | ||
==== Some suggestions for useful interaction with this dashboard could be : ==== | ==== Some suggestions for useful interaction with this dashboard could be : ==== | ||
| − | #Click on and select a particular computer from contribution of Computer pie chart. The rest of the visualization reflects | + | #Click on and select a particular computer from contribution of Computer pie chart. The rest of the visualization reflects Servers, Group, IP address etc with respect to the selected Computer. |
| − | #For further granular detection click on and select particular Group in Contribution of Group pie | + | #For further granular detection click on and select particular Group in Contribution of Group pie chart, now rest of the visualizations will reflect accordingly.In Summary table we can see all events for this particular Computer and Group on which scan was done and its details, risks found,omitted risk count etc. |
=== Symantec Antivirus Live Update Error Dashboard === | === Symantec Antivirus Live Update Error Dashboard === | ||
| − | Go to "Dashboards" from the left menu. From the list of in-built dashboards, select this one. It shall open the Dashboard. This Dashboard gives | + | Go to "Dashboards" from the left menu. From the list of in-built dashboards, select this one. It shall open the Dashboard. This Dashboard gives details about computers when errors occurred during live update activity. |
You can filter and search information and create new ones too. For help with Dashboards, click [[KHIKA Dashboards|here]] | You can filter and search information and create new ones too. For help with Dashboards, click [[KHIKA Dashboards|here]] | ||
| Line 258: | Line 293: | ||
==== A suggestion for useful interaction with this dashboard could be : ==== | ==== A suggestion for useful interaction with this dashboard could be : ==== | ||
| − | #Click on and select a particular Computer from Contribution of Computer name pie chart. The rest of the visualization reflects | + | #Click on and select a particular Computer from Contribution of Computer name pie chart. The rest of the visualization reflects all Errors, Update Types etc with respect to the selected Computer |
#For further granular detection on and select particular Error in Contribution of Error Pie chart ,now rest of the visualizations will reflect accordingly. | #For further granular detection on and select particular Error in Contribution of Error Pie chart ,now rest of the visualizations will reflect accordingly. | ||
| Line 296: | Line 331: | ||
=== Symantec Antivirus System In Risk Dashboard === | === Symantec Antivirus System In Risk Dashboard === | ||
| − | Go to "Dashboards" from the left menu. From the list of in-built dashboards, select this one. It shall open the Dashboard. This Dashboard gives summary information about on | + | Go to "Dashboards" from the left menu. From the list of in-built dashboards, select this one. It shall open the Dashboard. This Dashboard gives summary information about particular computers on which risk found and each risk count on daily basis. |
You can filter and search information and create new ones too. For help with Dashboards, click [[KHIKA Dashboards|here]] | You can filter and search information and create new ones too. For help with Dashboards, click [[KHIKA Dashboards|here]] | ||
| Line 331: | Line 366: | ||
==== Some suggestions for useful interaction with this dashboard could be : ==== | ==== Some suggestions for useful interaction with this dashboard could be : ==== | ||
| − | #Click on and select a particular Risk from Contribution of | + | #Click on and select a particular Risk from Contribution of Risk Name. The rest of the visualizations reflect the Computer, IP Address etc info for this Risk. |
| − | #For further drill down click on and select particular computer in Contribution of Computer Name Pie. Now rest of the visualization reflects for this Error also. | + | #For further drill down, click on and select particular computer in Contribution of Computer Name Pie. Now rest of the visualization reflects for this Error also. |
Summary table shows info for this particular risk and computer like IP Address,total count of Risk etc. | Summary table shows info for this particular risk and computer like IP Address,total count of Risk etc. | ||
=== Symantec Antivirus SEP Cant Take Action Dashboard === | === Symantec Antivirus SEP Cant Take Action Dashboard === | ||
| − | Go to "Dashboards" from the left menu. From the list of in-built dashboards, select this one. It shall open the Dashboard. This dashboard gives information about virus for which Symantec Endpoint Protection | + | Go to "Dashboards" from the left menu. From the list of in-built dashboards, select this one. It shall open the Dashboard. This dashboard gives information about virus for which Symantec Endpoint Protection could not take any action.Details like Risk names, computer, IP Address etc. is shown in Analytical Fashion. |
You can filter and search information and create new ones too. For help with Dashboards, click [[KHIKA Dashboards|here]] | You can filter and search information and create new ones too. For help with Dashboards, click [[KHIKA Dashboards|here]] | ||
| Line 416: | Line 451: | ||
=== Symantec Antivirus Alerts === | === Symantec Antivirus Alerts === | ||
| − | + | Alerts are generated when certain critical behavior is observed in the system. Alerts can be monitored in real-time on Alerts Dashboard in KHIKA. Relevant stakeholders can also receive the alerts via emails. The table below explains all the pre-canned alerts shipped with KHIKA App for Symantec Antivirus. | |
| − | Alerts are generated when certain critical behavior is observed in the system | ||
| − | |||
| − | |||
| − | |||
==== Alerts Description ==== | ==== Alerts Description ==== | ||
Latest revision as of 00:27, 31 March 2020
Contents
- 1 Introduction
- 2 Enabling Syslog forwarding on the device
- 3 Verifying SYSLOG data collection
- 4 How to Install the KHIKA App for Symantec Antivirus ?
- 5 Adding the device in the Adaptor
- 6 How to check the output of KHIKA Symantec Antivirus App ?
- 6.1 Discovering the logs of Syamntec Antrivirus
- 6.2 Symantec Antivirus Downloaded Content Update Failed Dashboard
- 6.3 Symantec Antivirus Virus Found Dashboard
- 6.4 Symantec Antivirus Malware Information Dashboard
- 6.5 Symantec Antivirus Scan Complete with Risk Dashboard
- 6.6 Symantec Antivirus Live Update Error Dashboard
- 6.7 Symantec Antivirus Multiple Virus Found Dashboard
- 6.8 Symantec Antivirus System In Risk Dashboard
- 6.9 Symantec Antivirus SEP Cant Take Action Dashboard
- 6.10 Symantec Antivirus Update Failed Dashboard
- 6.11 Symantec Antivirus Alerts
Introduction
Antivirus forms an important part of any organisations’ network and hence monitoring your Antivirus is imperative. Symantec Antivirus sends malware related information in the form of logs over syslog protocol. Syslog is very efficient and simple to integrate with. KHIKA Data Aggregator is pre-configured with syslog services on port 514. The key parts to get here are :
- Enabling Syslog forwarding on the device
- Installing the KHIKA App for Symantec Antivirus
- Get data from your Symantec Antivirus into KHIKA Aggregator
Enabling Syslog forwarding on the device
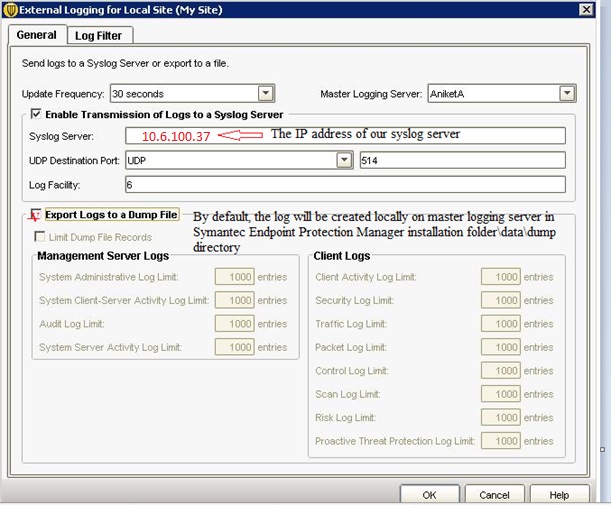
Please refer below steps for enabling syslogs on your Symantec Antivirus Server.
The procedure to enable for external logging is as mentioned below:
1. In the Symantec Endpoint Protection Management console, click Admin.
2. Click Servers.
3. Click the local site or remote site that you want to export log data from.
4. Click Configure External Logging.
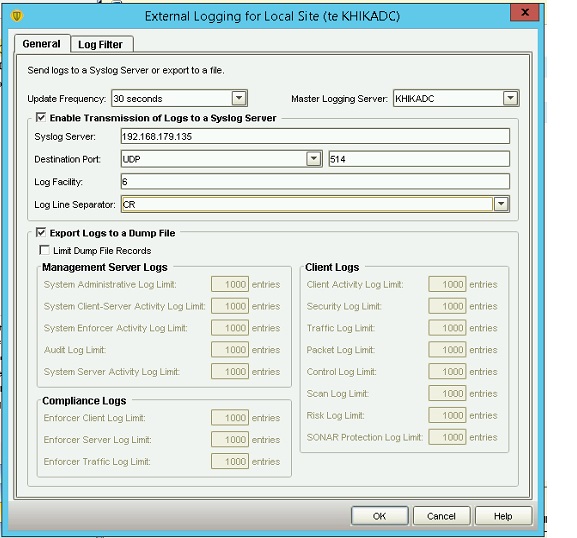
5. On the General tab, in the Update Frequency list box, select how often to send the log data to the file. (You can say 30 seconds here)
6. In the Master Logging Server list box, select the management server to send the logs to.
7. Use SQL Server and connect multiple management servers to the database, specify only one server as the Master Logging Server.
8. Check Enable Transmission of Logs to a SYSLOG Server.
9. Provide the following information: (NOTE: Firewall port 514 must be opened for syslog server to receive the messages)
SYSLOG Server – Specify the IP address or domain name of the KHIKA Virtual Appliance that embeds SYSLOG server that will receive the log data.
Destination Port & Protocol - Specify the protocol as ‘UDP’ and port as ‘514’
Log Facility – Specify the log facility as - 4
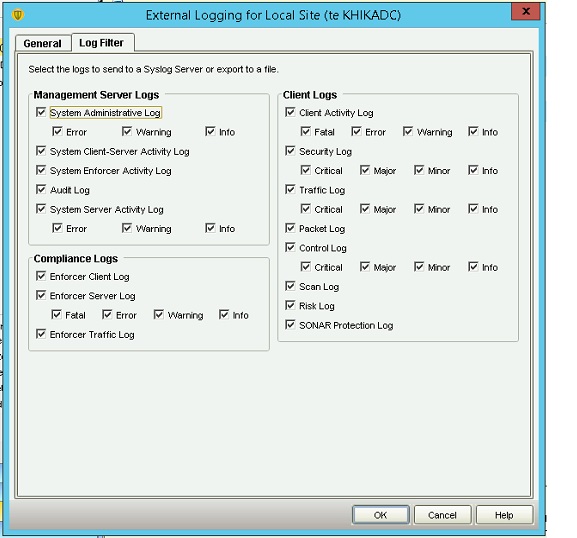
10. On the Log Filter tab, check which logs to export. (Select ALL the possible logs here)
11. Click OK.
Admin-> Servers-> Local Site -> Configure External Logging
Verifying SYSLOG data collection
After you enable the syslog forwarding on the end device, you must verify if the logs are being really received by KHIKA Data Aggregator. Please refer here to understand how to verify syslogs on KHIKA Data Aggregator.
How to Install the KHIKA App for Symantec Antivirus ?
It is assumed, that you have already configured KHIKA Data Aggregator in your environment. If not, please read how to configure KHIKA Data Aggregator and perform the pre-requisite steps.
This section explains how to pick and install the KHIKA application for Symantec Antivirus - Symantec Antivirus. Installing the application shall put together and activate the adapter (parser) that can handle Symantec Antivirus data format, the dashboards and the alert rules preconfigured.
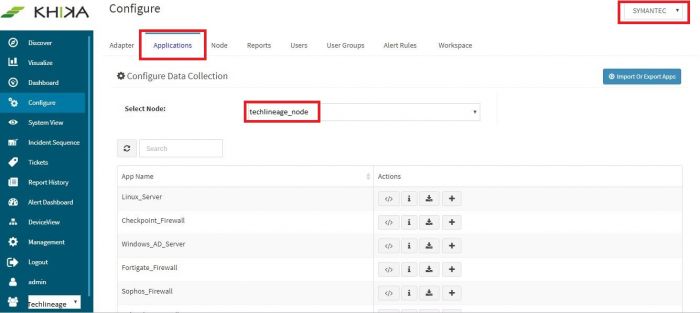
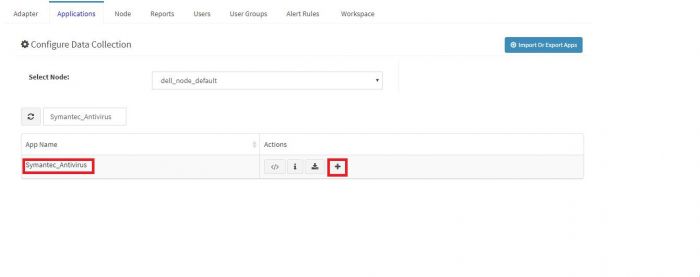
Go to “Applications” tab in the “Configure” menu.
Check whether the appropriate Workspace is selected. Note: Application is always loaded in a Workspace. Read the section on Workspaces to know more about KHIKA Workspaces. Also select your KHIKA aggregator name in the Node dropdown. This is to ensure that we are collecting data from the desired source and into the correct workspace which is ready with the configured application and components.
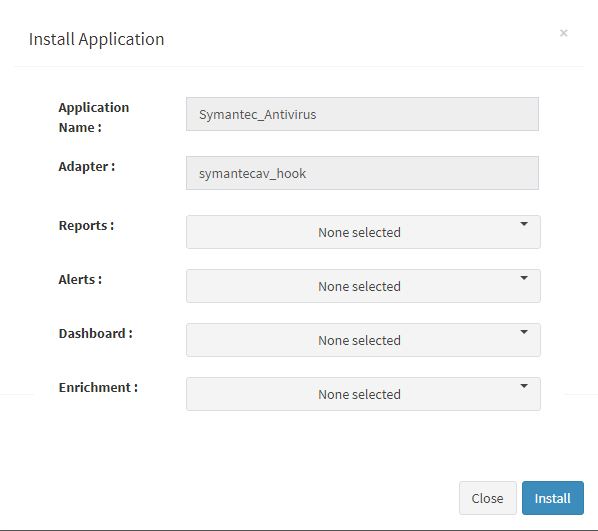
Click on the “+” button. A pop up appears.
Users can now select the contents of the application required. For example, on the dropdown for “Reports”, click to expand it. List of all reports can be seen. User can individually select the reports required by checking on the checkbox next to each. Alternatively, check on “Select All” option to get all of them. Similarly you can select content from Alerts and Dashboards.
Visit the sections on KHIKA Reports, KHIKA Dashboards, KHIKA Alerts & Correlations to know more about these topics.
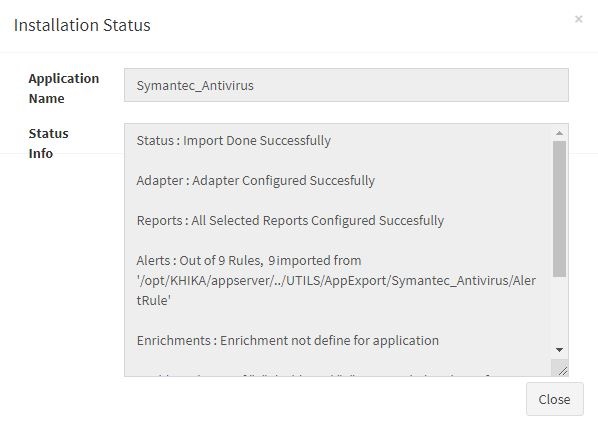
Click “OK” to proceed with the installation of the selected Application. After successful installation, following status should be displayed :
This simple procedure to install a KHIKA App, automatically configures the Adapter (required for parsing the data from raw syslogs), calculated KHIKA reports on raw data, Visualizations, Dashboards and Alerts – all in one click.
Adding the device in the Adaptor
After syslogs are enabled on the device and the App is installed in KHIKA, it is the time to add the device to the this App (in Adapter section of KHIKA Web GUI). Please refer here to know how to add the device to an App.
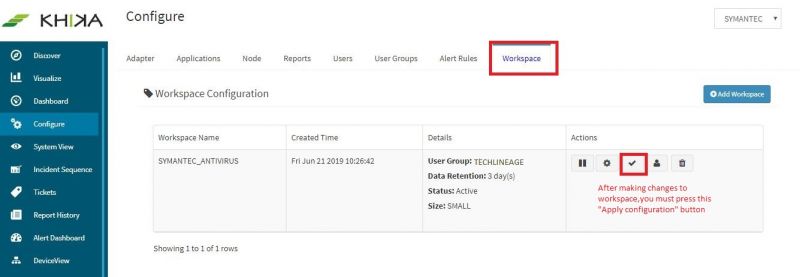
After making these configuration changes, we must apply these changes to the Workspace. Go to Configure, select the Workspace and in Workspace tab of configure menu press the Apply button as shown in the screenshot below.
Wait for a few minutes for changes to apply and data to arrive in kHIKA. With all these steps, we should now expect the data to arrive in KHIKA. Lets discover some live data in KHIKA.
How to check the output of KHIKA Symantec Antivirus App ?
Discovering the logs of Syamntec Antrivirus
After doing all the steps given above, we should start receiving live data into KHIKA. Go to "Discover" section in KHIKA GUI and select the index with name "*raw-symantec_antivirus*". Note that the index has a prefix of the customer name and workspace name. After selecting this index, you should see the live data coming in. Spend some time understanding this data and the fields of the data.
Symantec Antivirus Downloaded Content Update Failed Dashboard
Go to "Dashboards" from the left menu. From the list of in-built dashboards, select this one. It shall open the Dashboard. This dashboard gives information about which computer downloaded content successfully but updates have failed. Details like Server Name, Computer Name, source of download is shown in an analytical fashion. You can filter and search information. For help with Dashboards, click here
Elements in the Dashboard are explained below :
| Visualization | Description |
| Contribution Of Servers | Contribution of Server for Downloaded content update failed event. |
| Contribution of Computer | Contribution of Computer for Downloaded content update failed event. |
| Count Of Server wise downloaded from | X axis : All the Server which contain downloaded content update failed events Y axis : Stacked within each bar (ie. for each download from(download source)) the Server and count of events |
| Count Of Computer wise downloaded from | X axis : All the Computer which contain downloaded content update failed events Y axis : Stacked within each bar (ie. for each download from(download source)) Computer and count of events |
| Time trend | Trend of downloaded content update failed events over time. Useful to identify unusual spikes at a glance. X axis : date & time Y axis : count of events |
| Summary Table | Detailed data with timestamp and count |
Suggestion for useful interaction with this dashboard could be :
Click on and select a particular Computer from Contribution of Computer pie chart. The rest of the visualizations, reflect for all servers, server from which downloaded etc with respect to selected Computer.
Symantec Antivirus Virus Found Dashboard
Go to "Dashboards" from the left menu. From the list of in-built dashboards, select this one. It shall open the Dashboard. This gives information about any Virus found and its details like which machine, which user and what whas the action taken etc. You can filter and search information. For help with Dashboards, click here
Elements in the Dashboard are explained below :
| Visualization | Description |
| Contribution of Action | Which are the actions when Virus found |
| Contribution of Computer Name | Computer Names on which virus Found |
| Contribution of Server | Symantec Servers Name on which virus found |
| Contribution of User | Users Name when virus were found |
| IP Address wise Risk Name count | X axis : All IP Address for which virus were found Y axis : IP Address wise Risk name and its count. |
| Server wise Risk Name count | X axis :All the Symantec Antivirus Servers for which virus were found Y axis : Server Name wise Risk and its count |
| Time trend | Trend of virus found events over time. Useful to identify unusual spikes at a glance. X axis : date & time Y axis : count of events |
| Summary Table | Detailed data with timestamp and count |
Suggestions for useful interaction with this dashboard could be :
- Click on and select a particular computer from contribution of Computer Names pie. The rest of the visualization reflects all users, actions, risks etc with respect to the selected computer.
- For further granular detection click on and select particular action in Contribution of Actual Action pie chart ,now rest of the visualizations will reflect accordingly. In Summary table we can see all events for this particular computer name and action which is the Risk Name, Server IP Address etc.
Symantec Antivirus Malware Information Dashboard
Go to "Dashboards" from the left menu. From the list of in-built dashboards, select this one. It shall open the Dashboard. This dashboard gives summary of which malware's found and its daily count.Details like which is the Risk Name, Risk Count ,Category Type etc is shown in analytical fashion.
You can filter and search information. For help with Dashboards, click here
Elements in the Dashboard are explained below :
| Visualization | Description |
| Contribution of Risk Names | Contribution of All Risk Names |
| Contribution of Category Type | Contribution of All Category type for Malware events |
| Category Type wise Risk Name count | X axis : All category Type in Malware events Y Axis : Category Type wise Risk Name and its event count |
| Risk Name wise Count | X axis : All the Risk Name Y axis : Each Risk Count |
| Daily trend | Trend of daily malware event count. Useful to identify unusual spikes at a glance. X axis : date & time Y axis : count of events |
| Summary Table | Detailed data with timestamp and count |
Some suggestions for useful interaction with this dashboard could be :
Click on and select a particular Risk from contribution of Risk Name Name pie chart. The rest of the visualizations will reflect accordingly.
Symantec Antivirus Scan Complete with Risk Dashboard
Go to "Dashboards" from the left menu. From the list of in-built dashboards, select this one. It shall open the Dashboard. This report shows details of each computer on which antivirus scan was done and its details, risks found in the scan and how many risks were omitted.
You can filter and search information and create new ones too. For help with Dashboards, click here
Elements in the Dashboard are explained below :
| Visualization | Description |
| Contribution of Computers | Computers on which scan completed |
| Contribution of Groups | Group Name which are in Scan |
| Contribution of Servers | Symantec Serves on which scan is done |
| IP Address Wise Count | X axis : All the IP Address in Scan Y axis : IP Address wise risk count |
| Begin Time Daily trend | Trend of when scan begin over time. Useful to identify unusual spikes at a glance. X axis : date & time Y axis : count of events |
| End Time Daily trend | Trend of when scan ends over time. Useful to identify unusual spikes at a glance. X axis : date & time Y axis : count of events |
| Summary Table | Detailed data with timestamp and count |
Some suggestions for useful interaction with this dashboard could be :
- Click on and select a particular computer from contribution of Computer pie chart. The rest of the visualization reflects Servers, Group, IP address etc with respect to the selected Computer.
- For further granular detection click on and select particular Group in Contribution of Group pie chart, now rest of the visualizations will reflect accordingly.In Summary table we can see all events for this particular Computer and Group on which scan was done and its details, risks found,omitted risk count etc.
Symantec Antivirus Live Update Error Dashboard
Go to "Dashboards" from the left menu. From the list of in-built dashboards, select this one. It shall open the Dashboard. This Dashboard gives details about computers when errors occurred during live update activity.
You can filter and search information and create new ones too. For help with Dashboards, click here
Elements in the Dashboard are explained below :
| Visualization | Description |
| Contribution of Server | Contribution of Servers(which added in KHIKA) |
| Contribution of Computer Name | Contribution of Computer on which error occurred during live update |
| Contribution of Error | Contribution of Error which occurred in live update activity. |
| Computer Wise Error count | X axis : All computer name in live update activity Y axis : Computer wise each error and its count |
| Daily Trend | Trend of login events over time. Useful to identify unusual spikes at a glance. X axis : date & time Y axis : count of events |
| Summary Table | Detailed data with timestamp and count |
A suggestion for useful interaction with this dashboard could be :
- Click on and select a particular Computer from Contribution of Computer name pie chart. The rest of the visualization reflects all Errors, Update Types etc with respect to the selected Computer
- For further granular detection on and select particular Error in Contribution of Error Pie chart ,now rest of the visualizations will reflect accordingly.
Symantec Antivirus Multiple Virus Found Dashboard
Go to "Dashboards" from the left menu. From the list of in-built dashboards, select this one. It shall open the Dashboard. This dashboard gives information about multiple virus found on same machine.
You can filter and search information and create new ones too. For help with Dashboards, click here
Elements in the Dashboard are explained below :
| Visualization | Description |
| Contribution of computer | Names and contribution of the permissions given |
| Computer wise Risks | X axis : computer Name on which multiple virus found Y axis : Virus found on each Computer. |
| Time trend | Trend of multiple virus found on same machine over time. Useful to identify unusual spikes at a glance. X axis : date & time Y axis : count of events |
| Summary Table | Detailed data with timestamp and count |
A suggestion for useful interaction with this dashboard could be :
Click on and select a particular Computer from Contribution of Computers. The rest of the visualization reflects all Error, Update Type etc info with respect to the selected Computer.
Symantec Antivirus System In Risk Dashboard
Go to "Dashboards" from the left menu. From the list of in-built dashboards, select this one. It shall open the Dashboard. This Dashboard gives summary information about particular computers on which risk found and each risk count on daily basis.
You can filter and search information and create new ones too. For help with Dashboards, click here
Elements in the Dashboard are explained below :
| Visualization | Description |
| Contribution of Computer | Name and Contribution of Computer on which Risk Found |
| Contribution of Risk Name | Name and Contribution of Risks |
| IP Address wise RiskName | X axis : IP address Y axis : Computer wise each Risk and its count |
| Computer wise RiskName | X axis : Computer Name Y axis : Computer wise each Risk and its count |
| Daily Trend | Trend of daily risk found over time. Useful to identify unusual spikes at a glance. X axis : date & time Y axis : count of events |
| Summary Table | Detailed data with timestamp and count |
Some suggestions for useful interaction with this dashboard could be :
- Click on and select a particular Risk from Contribution of Risk Name. The rest of the visualizations reflect the Computer, IP Address etc info for this Risk.
- For further drill down, click on and select particular computer in Contribution of Computer Name Pie. Now rest of the visualization reflects for this Error also.
Summary table shows info for this particular risk and computer like IP Address,total count of Risk etc.
Symantec Antivirus SEP Cant Take Action Dashboard
Go to "Dashboards" from the left menu. From the list of in-built dashboards, select this one. It shall open the Dashboard. This dashboard gives information about virus for which Symantec Endpoint Protection could not take any action.Details like Risk names, computer, IP Address etc. is shown in Analytical Fashion.
You can filter and search information and create new ones too. For help with Dashboards, click here
Elements in the Dashboard are explained below :
| Visualization | Description |
| Contribution of Computer Names | Name of the computer on which virus found and SEP can not action |
| Contribution of Servers | Contribution of Symantec AV Servers |
| Contribution of Risk Name | Names and contribution of Risk on which SEP can not action |
| IP Address wise Risks | X axis : IP Address Y axis : IP Address wise Risk found on which SEP can not take action and each risk count . |
| Time trend | Trend of SEP can not take action events over time. Useful to identify unusual spikes at a glance. X axis : date & time Y axis : count of events |
| Summary Table | Detailed data with timestamp and count |
A suggestion for useful interaction with this dashboard could be :
Click on and select a particular Risk Name from contribution of Risk Name pie chart. The rest of the visualizations reflects for all Computer,IP Address etc with respect to the selected Risk Name.
Symantec Antivirus Update Failed Dashboard
Go to "Dashboards" from the left menu. From the list of in-built dashboards, select this one. It shall open the Dashboard. This dashboard gives information about update failed for to load or install.
You can filter and search information and create new ones too. For help with Dashboards, click here
Elements in the Dashboard are explained below :
| Visualization | Description |
| Contribution of Computer Names | Name Computer and Contribution for which update failed |
| Contribution of Servers | Contribution of Symantec AV Servers |
| Contribution of Errors | Contribution of Error : Failed to Load and Failed to Install |
| Computer Wise Update Count | X axis : Computer Name Y axis : Computer wise update type which is failed and its event count. |
| Time trend | Trend of SEP can not take action events over time. Useful to identify unusual spikes at a glance. X axis : date & time Y axis : count of events |
| Summary Table | Detailed data with timestamp and count |
A suggestion for useful interaction with this dashboard could be :
- Click on and select a particular Computer from Contribution of Computer name pie chart. The rest of the visualizations reflects for all Error, Update Type etc with respect to the selected Computer.
- For further granular detection click on and select particular Error in Contribution of Error Pie chart ,Now rest of the visualizations will reflect accordingly.
Symantec Antivirus Alerts
Alerts are generated when certain critical behavior is observed in the system. Alerts can be monitored in real-time on Alerts Dashboard in KHIKA. Relevant stakeholders can also receive the alerts via emails. The table below explains all the pre-canned alerts shipped with KHIKA App for Symantec Antivirus.
Alerts Description
| Alert Name | Description | Suggested Resolution |
| Host with multiple infections | This alert is triggered when host is infected with multiple(two or more) viruses within a 5 minutes of interval. | A host infected with multiple viruses is a good indication of a compromised host and this becomes a weak link in the network and can be used by the attacker to launch sophisticated attacks. Quarantine the host. Understand the behavior of the host by checking recent history (such as websites visits from proxy or firewall logs, email download, USB events if any). Check hosts showing similar threats. Try to correlate the behavior. |
| Antivirus audit policy changed | This alert is triggered when someone modifies the system audit policy. | Someone modified system audit policy. Check with admin. Check if CR was in place. |
| Virus Infection Detected | This alert is triggered when system Symantec detects virus on the system. | System is affected with virus. It is normal as long as the Symantec AV is cleaning the virus. No immediate action is needed. However, if the same system is getting affected with virus/viruses multiple times, the system should be deeply inspected for |
| Single virus outbreak on few hosts | This is alert is triggered when malware is found on multiple hosts but not cleaned. | This is a typical case of a virus spreading laterally.
Quarantine the affected hosts. Clean the virus. Check threat intelligence (VirusTotal etc.) for virus source. Check with your AV experts |
| Malware detected but not cleaned | This alert is triggered when malware is detected on a host but not cleaned within 24 hours of time window. | An uncleaned malware is dangerous. The machine remains in compromised state and it could be a potential danger to the entire network. Clean the malware manually. Check the reason why was it not cleaned. |
| Antivirus audit policy added | Alert triggered when someone modifies the system audit policy,typically added new policy. | Someone modified system audit policy. Check with admin. Check if CR was in place. |
| variety of viruses on multiple hosts | This alert is triggered when multiple viruses are detected on multiple hosts but not cleaned. | Multiple host have been infected with different viruses within a short time span. This is a typical case of virus outbreak showing multiple varieties.
To treat the symptom, quarantine the affected hosts. Clean the virus. Check threat intel (VirusTotal etc.). It may happen that the hosts are infected with similar type viruses, with different names. This could be lateral spread of the virus. Consult virus experts to now more about the type of the virus |
| single virus outbreak on multiple hosts | This alert is triggered when typical case of virus outbreak is detected that shows multiple hosts are detected with multiple of same virus within short time span. | Multiple host have been infected with same or different viruses within a short time span. This is a typical case of virus outbreak.
To treat the symptom, quarantine the affected hosts Clean the virus. Check threat intel (VirusTotal etc.). It may happen that the hosts are infected with similar viruses, with different names. This could be lateral spread of the virus. Consult virus experts to know more about the type of the virus |
| Multiple malware detected but not cleaned | This alert is triggered when uncleaned malware is detected on a host. | An uncleaned malware is dangerous. The machine remains in compromised state and it could be a potential danger to the entire network. Clean the malware manually. Check the reason why was it not cleaned. It is also important to investigate why multiple infections were seen on a single host
|
