Difference between revisions of "FAQs"
(→Dealing with Ossec Device in KHIKA) |
(→Dealing with Ossec Device in KHIKA) |
||
| Line 184: | Line 184: | ||
1. Time out Error | 1. Time out Error | ||
Check if you are getting following Error while adding the device. | Check if you are getting following Error while adding the device. | ||
| − | [[File: Ossec_device1.jpg|700px]]<br> | + | [[File: Ossec_device1.jpg|700px]]<br><br> |
| − | This means your aggregator is not connected to KHIKA AppServer | + | This means your aggregator is not connected to KHIKA AppServer.<br> |
Check if your aggregator is connected to KHIKA server. | Check if your aggregator is connected to KHIKA server. | ||
1. Go to node tab in KHIKA GUI. | 1. Go to node tab in KHIKA GUI. | ||
Revision as of 10:53, 12 August 2019
Contents
- 1 How to check if raw syslog data is received in the system? What if it is not received?
- 2 Why can’t I see any raw data on Discover Screen?
- 3 How to select data related to a particular device on your Dashboard?
- 4 How do I estimate my per day data?
- 5 SMTP settings in KHIKA
- 6 Dealing with Syslog Device in KHIKA
- 7 Dealing with Ossec Device in KHIKA
- 8 Disk Space is Full
- 8.1 Size of indexes representing raw logs grows too much
- 8.2 Processe's log files does not get deleted
- 8.3 Postgres database size get increases
- 8.4 Report's files does not get archived
- 8.5 Raw log files does not get archive and deleted for ossec and syslog device
- 8.6 Cold/Offline storage partition gets full or unmounted
- 8.7 Elasticsearch snapshot archival utility not working properly
How to check if raw syslog data is received in the system? What if it is not received?
In the section for adding data of syslog based devices we have explained how to enable syslog forwarding on the the data sources first and then add that device into KHIKA. When we add a device successfully, we can see the device entry in the “List of Devices” tab. (For this, go to Configure – Adapter – Manage Devices next to that Adapter.)
However if raw syslogs are not received from that device, we get an error while adding the device.
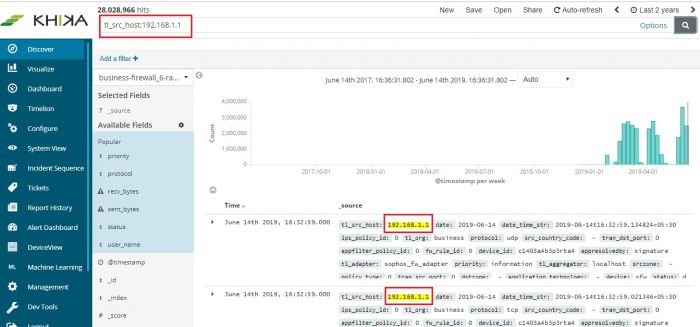
It is recommended to wait for upto 10 minutes before checking its data. To check whether we are receiving this device’s data in KHIKA, go to “Discover” screen from the left menu. Search for the IP address of the device in the search textbox on the top of the screen.
In our example from the image, IP address is “10.2.5.6”. In the search bar in the Discover screen, just enter “10.2.5.6”. This is for showing up any and all data relevant to the device with this IP.
If you can see data for this IP address, the logs are being received into KHIKA successfully.
If not, please check section for adding data of syslog based devices. Both the steps – adding a device in KHIKA as well as forwarding syslogs from that device to KHIKA should be verified again.
Why can’t I see any raw data on Discover Screen?
On the Discover screen, you have to choose 2 things to bring up your data :
- Time duration
- Index pattern
Select the required index pattern from the dropdown on the left of the Discover Screen. This selects your data type and whether it is “raw” or calculated “rpt” data. Refer section for help on changing index
Then select the time duration of data you want to see from the time picker functionality on top right. Selecting time window is explained here
If time duration is selected too large, it may severely affect the performance of MARS. We recommend not selecting the data beyond Last 24 hours. Your searches may time out if you select large Time Ranges.
Reduce your time window and try again. It is advised to keep a lesser time window. However on the contrary, if there is no / very less data in the picked time window, you might want to increase your time window from the time picker and load the screen again.
Every dashboard in KHIKA will have multiple devices' data in it. For example, a linux logon dashboard has information about all the linux devices in the "LINUX" workspace say. the name of the relevant workspace is appears before the name of the dashboard.
To see data on the dashboard for only one linux device, you have to select the required device on your Dashboard. There are couple of ways to select an APV on your dashboard :
- Add a filter
- Enter Search query
The following procedure is applicable to all Dashboards.
Steps for Adding a Filter
On each dashboard, there is an option, “Add a filter”. Click on the “+” sign to add a new one. Use the simple drop downs in combination, to create your logical filter query.
faq3.1
faq3.2
The first dropdown is the list of fields from our data. We have selected “server_ip” here. The second dropdown is a logical connector. We have selected “is” in this dropdown. The third dropdown has the values of this field. We have selected one device say 10.13.1.3 here. So now, our filter query is : “server_ip is 10.13.1.3”
Click on Save at the bottom of this filter pop up.
Your Dashboard now shows data for only the selected device in all the pie charts, bar graphs and summary table – everywhere in the dashboard.
The applied filter is seen on top.
faq3.3
To remove the filter, hover on the filter icon on top (selected in red in above figure). Icons appear. Click on the bin icon ifaq3.1 to remove the filter. The Dashboard returns to its previous state.
faq3.4
Please Note : If this is just a single search event, donot follow further steps. If you want to save this search for this particular device with the Dashboard, follow steps given further to save the search.
Click on Edit link on the top right of the Dashboard – Save link appears. Click on Save to save this search query with the dashboard.
faq3.5
The filter currently applied shall continue to be seen on top of your Dashboard. You can remove this filter at any point of time in the future by clicking on the bin icon on your dashboard – as already explained.
Steps to Search and Save
On the top of the Dashboard, there is a text box for search. Enter your device search query for a particular device in this box.
faq3.6
We have entered server_ip:”10.13.1.3” . This is the syntax for server_ip equals to 10.13.1.3. Click on the rightmost search button in that textbox to search for this particular device on the dashboard.
All the elements on the Dashboard shall now reflect data for the selected device.
faq3.7
Please Note : If this is just a single search event, donot follow further steps. If you want to save this search for this particular device with the Dashboard, follow steps given further to save the search.
Click on Edit link above the search textbox – Save link appears. Click on Save to save this search query with the dashboard.
faq3.8
This shall stay with the Dashboard and will be seen every time we open the Dashboard.
To remove the search, select the search query which you can see in that textbox, remove / delete it. Click on Edit and Save the Dashboard again. It changes back to its previous state.
faq3.9
How do I estimate my per day data?
Please refer the dedicated section to calculate your per day data size in KHIKA
SMTP settings in KHIKA
We need to make SMTP settings in KHIKA so that KHIKA alerts and reports can be sent to relevant stakeholders as emails.
Please refer the dedicated section for SMTP settings
Dealing with Syslog Device in KHIKA
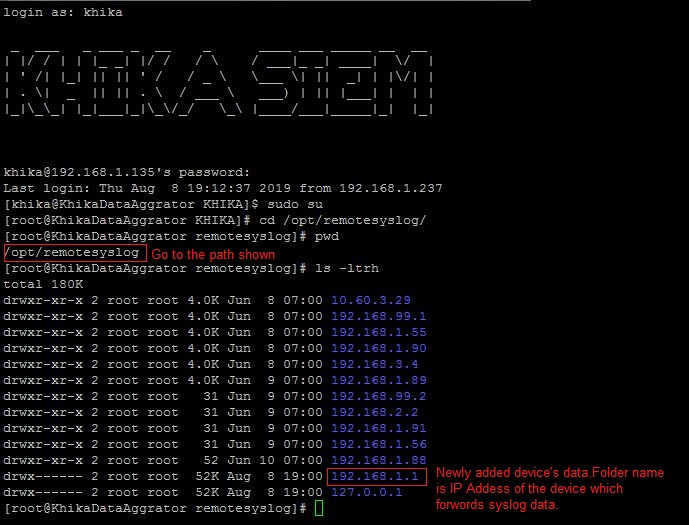
Syslog service is pre-configured on your KHIKA aggregator server (on UDP port 514). Syslogs are stored in /opt/remotesylog directory with IP address of the sending device as directory name for each device sending data. This way, data of each device is stored in a distinct directory and files. For example, if you are sending syslogs from your firewall which as IP of 192.168.1.1, you will see a directory with the name /opt/remotesylog/192.168.1.1 on KHIKA Data Aggregator. The files will be created in this directory with the date and time stamp <example : 2019-08-08.log>. If you do a "tail -f" on the latest file, you will see live logs coming in.
When you want to add a new device into KHIKA
1. Note the IP address of your KHIKA Data Aggregator.
2. Please refer to OEM documentation on how to enable Syslogs. We encourage you to enable the lowest level of logging so that you capture all the details. Syslog server where logs should go is IP address of your KHIKA Data Aggregator and port should be UDP 514.
   For enable syslog of preconfigured apps in KHIKA click on the below link:
   • Symantec Antivirus
   • Cisco Switch
   • Checkpoint Firewall
   • Fortigate Firewall
   • PaloAlto Firewall
   • Sophos Firewall
3. Note the IP address of the device sending the logs (example 192.168.1.1)
4. Now go to KHIKA Data Aggregator and login as "khika" user and do "sudo su".
5. cd to /opt/remotesylog and do "ls -ltr" here. If you see the directory with the name of the ip of the device sending the data, you have started receiving the data in syslogs.
Data is not receiving on Syslog Server
- please wait for some time.
- Some devices such as switches, routers, etc don’t create too many syslogs.
- It depends on the activity on the device. Try doing some activities such as login and issue some commands etc. The intention is to generate some syslogs.
- Check if logs are generating and being received on KHIKA Data Aggregator in the directory "/opt/remotesylog/ip_of_device". Do ls -ltrh
- If logs are still not being received, Please check the following points.
- Check firewall settings on KHIKA Data Aggregator. Wait for some time perform some actions on the end device to generate logs and check in directory /opt/remotesylog/ip_of_device. Do "ls -ltr"
   Check firewall status
   systemctl status firewalld
   If firewall status is active, then do the following commands to inactive and disable firewalld.
   systemctl stop firewalld
   systemctl disable firewalld
   Flush iptables
   sudo iptables –flush
- Check if there is any firewall between KHIKA Data Aggregator and allow communication from device to KHIKA Data Aggregator on port 514 (UDP)
- Login to KHIKA Data Aggregator and do tcpdump
sudo tcpdump -i any src <ip_of_ device> and port 514
If you see the packets being received by tcpdump, restart syslog service using command.
   systemctl syslog-ng stop, Then wait for some time.
   systemctl syslog-ng start
Make sure you are receiving the logs in the directory /opt/remotesylog/ip_of_device Go to Started Receiving the logs only after you start receiving the logs.
Started Receiving the logs on Syslog server
Now you need to add a device from KHIKA GUI.
If the similar device of a data source has already been added to KHIKA
- Add this device to the same Adapter using following steps explained here.
- Else, check if App for this device is available with KHIKA. If the App is available, load the App and then Add device to the adapter using the steps explained here.
- Else, develop a new Adapter (and perhaps a complete App) for this data source. Please read section on how to write your own adapter on Wiki, after writing your own adapter, testing it, you can configure the adapter and then start consuming data into KHIKA. Explore the data in KHIKA using KHIKA search interface
Dealing with Ossec Device in KHIKA
Failing to add ossec based device
1. Time out Error
Check if you are getting following Error while adding the device.
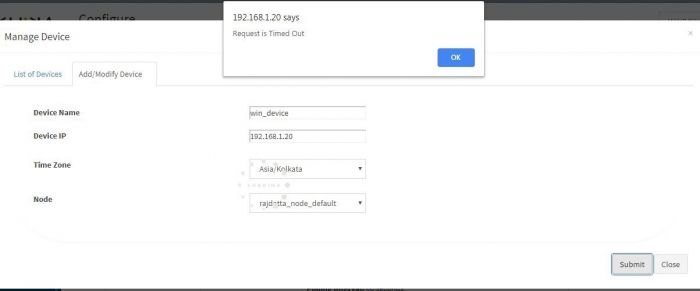
This means your aggregator is not connected to KHIKA AppServer.
Check if your aggregator is connected to KHIKA server.
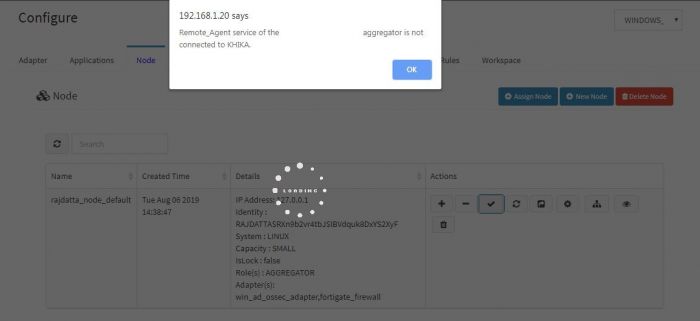
   1. Go to node tab in KHIKA GUI.
   2. Click on Check Aggregator Status button as shown in the screenshot below


   3. If it shows that the aggregator is not connected to KHIKA Server, it means that you aggregator is not connected to KHIKA AppServer.<enter link here that explains check aggregator status and solve the problem ><vrushali>
2. Device is already present
Check if you are getting the following message while adding the device
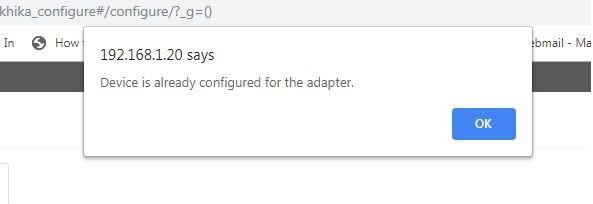
We cannot add the same device twice, Check if you already have added the device in the device list.
Ossec Agent And Ossec Server Connection issue
Disk Space is Full
Case raise whenever disk space gets full
In KHIKA there are generally three kinds of partitions
1. root (/) partition which generally contains appserver + data.
2. Data (/data) partition contains index data which include raw, reports and alerts.
3. Cold/Offline data (/offline) partition which is generally NFS mounted partition.
And this type of partition contains offline i.e. archival data which is not searchable.
To find out which partition is full use following commands
   1. df -kh
      above command will give you disk space utilization summary according to partitions.
   2. du -csh * or du -csh /data
      above command will give directory wise space usage summary.
Disk Full Reason
- Size of indexes, representing raw logs grows too much.
- Processe's log files does not get deleted (log files of KHIKA processes are huge)
- Postgres database size get increases (when you store too many reports, alerts etc)
- Report's files does not get archived(Reports are CSV and are stored as separate indexes)
- Raw log files does not get archive and deleted for ossec and syslog device(ossec raw files are big, so are syslogs)
- Cold/Offline storage partition gets full or get unmounted(which means, a snapshot of hot data can't happen).
- Elasticsearch snapshot archival utility not working properly (which means, a snapshot of hot data can't happen).
Size of indexes representing raw logs grows too much
The goal is to find the index that eats up maximum space.
Find out from which data source you are getting more logs using a utility like dev tools (you need to be KHIKA Admin to access dev tools)
Use following commands to find out disk space usage accordingly indices
1. GET _cat/indices
Above command will give all indices (see below screenshot). This command will give outputs as index name, size, number of shards, its current status like green, yellow, red, etc.
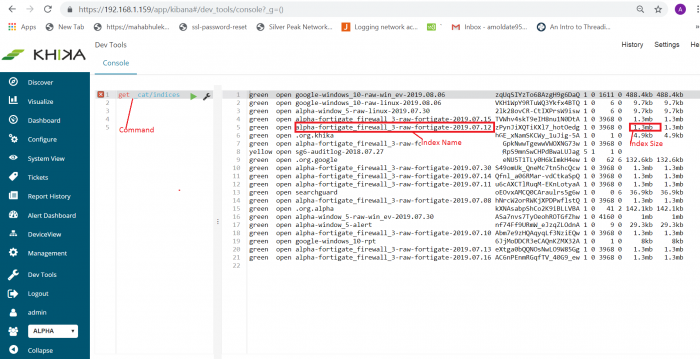
For example, if you want to find out indices only for FortiGate data source use command like
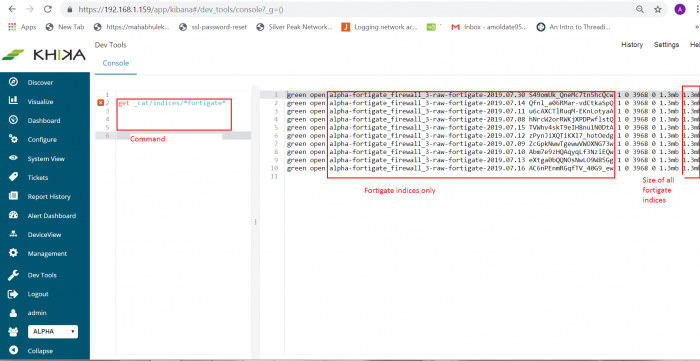
2. GET _cat/indices/*fortigate*
This command will give only FortiGate data source indices along with its name, status, size, etc. See below screenshot for reference.
If you find that disk space is utilized due to raw indices
1. Make sure that the data retention period (TTL) is reasonable. By going at workspace tab of configure page and modified it if required By going at workspace tab of configure page and modified it if required
configure -> Modify this workspace -> Data Retention -> Add required data retention ->save
2. Archive using snapshot archival utility( kindly refer steps how to configure it). Note that Archival needs space on the cold-data destination.
3. If there is no chance to free disk space then delete old large indices.Let say if you want to delete index “alpha-fortigate_firewall_3-raw-fortigate-2019.07.30” then use the following command in dev tools (You must be a KHIKA Admin )
   i.  POST alpha-fortigate_firewall_3-raw-fortigate-2019.07.17/_close
   ii. DELETE alpha-fortigate_firewall_3-raw-fortigate-2019.07.17
Processe's log files does not get deleted
If you found process log files does not get deleted.
1. Use following command to find out disk usage of log files. Log files stored as *.log extention.
sudo find /opt/KHIKA/ -iname "*.log" -type f | grep -v kafka | xargs du -hs | sort -rh
above command will give the output of filename and it's size (see below screenshot)
2. Use command rm to remove files.
for example, to remove file “/opt/KHIKA/alertserver/log/alertserver_debug_2336.log” use below command.
rm -rf /opt/KHIKA/alertserver/log/alertserver_debug_2336.log
3. Make Sure log file clean up a cronjob is working (/opt/KHIKA/UTILS/manage_logs.sh)
to check cronjob use following command
# crontab -l, this will give output as follow.

Here clean up cron job configure for every day at 7 am
4. If any directory entry is missing from clean up cronjob then add it into "/opt/KHIKA/UTILS/manage_logs.sh"
Steps to add missing entry
   • vi /opt/KHIKA/UTILS/manage_logs.sh
   • Enter in insert mode by pressing “i” on keyboard.
   • Add missing entry. Let say “/opt/KHIKA/collection/log” directory is missing then add it's entry to delete log file which is older than 7 days as follows
     find /opt/KHIKA/collection/log -mtime +7 -delete
   • Press key “Esc” to enter in command mode.
   • Press  key “:wq” to save and exit.
5. On aggregator node Make sure following properties is set to "false" in "/opt/KHIKA/collection/bin/Cogniyug.properties" file.
remote.dontdeletefiles = false
open file opt/KHIKA/collection/bin/Cogniyug.properties using common editor like vi/vim add property and then save and exit.
If property “remote.dontdeletefiles” is not set to “false”, Aggregator will create .out and .done file in directory “/opt/KHIKA/collection/Collection” and “/opt/KHIKA/collection/MCollection” and will never delete it. This will eat up space on aggregator. Setting property to false will delete the .out and .done files
Postgres database size get increases
Using a utility like du -csh, If you found Postgres data directory(/opt/KHIKA/pgsql/data) taking more space then find out which table taking more space using following steps
1. To execute SQL command you will need access of PostgreSQL console. To get access of PostgreSQL use following command in order
   • . /opt/KHIKA/env.sh
   • psql -d khika_db -U khika  -W
   • after enetring above command it will prompt for password .Enter the password
2. Use the following SQL command.
SELECT relname as "Table", pg_size_pretty(pg_total_relation_size(relid)) As "Size", pg_size_pretty(pg_total_relation_size(relid) - pg_relation_size(relid)) as "External Size" FROM pg_catalog.pg_statio_user_tables ORDER BY pg_total_relation_size(relid) DESC limit 10;
Above SQL command will return top 10 table which has more size. generally, it will return the following tables.
• collection_statistics
• collection_samples
• moving_avg_sigma
• alert_details
• and report related tables
3. Let say if you found that collection_statistics table taking more space then delete data from a table from which is less than the 2018 year and Use SQL command
delete from collection_statistics where date_hour_str <= '2018-12-31';
OR, if you want to delete from collection_samples table then use the following command
delete from collection_samples where date_string <='2018-12-31';
OR, if you want to delete data from table moving_avg_sigma then use the following command
delete from moving_avg_sigma
OR, if you want to delete data from alert_details table then use the following SQL commands. (Note: it is recommended that keep alerts data at least for three years).For example, delete before the year of 2015 then use following commands
   1. delete from alert_source_device_mapping where alert_id in (select alert_id from alert_details where dtm <=( SELECT EXTRACT(epoch FROM TIMESTAMP '2015-12-31')));

   2. delete from alert_device_mapping where alert_id in (select alert_id from alert_details where dtm <=( SELECT EXTRACT(epoch FROM TIMESTAMP '2015-12-31')));

   3. delete from alert_status_audit where alert_id in (select alert_id from alert_details where dtm <=( SELECT EXTRACT(epoch FROM TIMESTAMP '2018-12-31')));

   4. delete from alert_details where dtm <=( SELECT EXTRACT(epoch FROM TIMESTAMP '2015-12-31'));
NOTE: if you found any other tables which are not in step (2) then contact an administrator.
Report's files does not get archived
Reports CSV files get stored at location "/opt/KHIKA/appserver/reports" and "/opt/KHIKA/eserver/reports" If you found that above mentioned directories taking more space.Then do following steps
1. Make sure archival cron is configured for reports (/opt/KHIKA/UTILS/manage_logs.sh)Use following command to check cron
crontab -l
2. Make sure the following entries is present in file /opt/KHIKA/UTILS/manage_logs.sh
   • find /opt/KHIKA/appserver/reports -mtime +7 -type f | xargs gzip

   • find /opt/KHIKA/tserver/reports -mtime +7 -type f | xargs gzip

   • find /opt/KHIKA/eserver/reports -mtime +7 -type f | xargs gzip
If above entry is missing then add it using common editor like vi or vim.
3. If reports it is too old and there is no chance to free disk space then delete the reports. Use the following commands to delete report files which are older than 1 year
   • find /opt/KHIKA/appserver/reports  -type f -mtime +365 -delete

   • find /opt/KHIKA/tserver/reports  -type f -mtime +365 -delete

   • find /opt/KHIKA/eserver/reports  -type f  -mtime +365 -delete
Raw log files does not get archive and deleted for ossec and syslog device
On Aggregator node, Raw logs are stored at "/opt/ossec/logs/archives" for Ossec devices and "/opt/remotesyslog" for Syslog devices. On Aggregator by default we keep raw logs only for three days. If you find raw logs more than three days then delete it and configure cron job for the same. Add following cronjob "/opt/KHIKA/UTILS/manage_rawdata_logs.sh"
Steps to add a cronjob
1. login as user khika on KHIKA Aggregator server. 2. Enter crontab -e command. 3. Add following entry “* */2 * * * /opt/KHIKA/UTILS/manage_rawdata_logs.sh >/dev/null 2>&1” to run cronjob every 2 hour.4. Press “ESC” key 5. Press key “:wq” to save and exit.

Cold/Offline storage partition gets full or unmounted
If cold/offline storage partition gets full
Every organization keeps cold data according to their data retention policy (1 year, 2 years, 420 days, etc). If there is data which is more than organization policy data retention period then delete it.
To delete data use following command
find location -iname “*.tar.gz”-type f -mtime +days -delete
For example, Let say offline storage location is “/opt/KHIKA/Data/offline” and the retention period is 420 days then use the following command to delete data.
find /opt/KHIKA/Data/offline/ -iname “*.tar.gz” -type f -mtime +420 -delete
The cold data is typically stored on cheaper storage and is mounted using NFS. Sometimes, nfs storage partition gets unmounted
1. If you know the NFS server and its shared location then refer the following command to mount it again
mount -t nfs 192.168.0.100:/nfsshare /mnt/nfsshare
where "192.168.0.100" is nsf server and "/nfsshare" is share location and "/mnt/nfsshare" is mount point.
2. Contact server administrator to mount offline storage
Elasticsearch snapshot archival utility not working properly
Elasticseacrh Snapshot utility raises an alert when it fails to snapshot.
Alert status is "archival_process_stuck"
Alert status message "archival_process_stuck" indicates that the process is taking more than 24 hours for a single bucket. This may happen due to a script is terminated abnormally or compression operation is taking more time. Check logs and find an issue. find the current state of recent archival and change it accordingly. To change the current state of archival you will need PostgreSQL access use following command
   To get access of PostgreSQL

   1. . /opt/KHIKA/env.sh
   2. psql -d khika_db -U khika  -W


   3. After enetring above command it will prompt for password .Enter the password.
1. If archival bucket state is "COMPRESSING", "COMPRESSING_FAILED", then make its state as "SUCCESS" use following SQL command
NOTE: Before updating Find out required id of the record in table use following SQL command
1. select id from application_transformerarchivalaudit where status in ('COMPRESSED' ,'COMPRESS_FILE_MOVE_FAILED')
Above command will return id, use this in next subsequent command. Let say command return id as 1.
2. update application_transformerarchivalaudit set status='SUCCESS' where id =1
2. If archival bucket state is "COMPRESSED", "MOVING_COMPRESSED_FILE" or "COMPRESS_FILE_MOVE_FAILED" then move archival to offline storage (if available ) and update it's state to "COMPLETED"
NOTE: Before updating Find out required id of the record in table use following SQL command
1. select id from application_transformerarchivalaudit where status in ('COMPRESSED','MOVING_COMPRESSED_FILE','COMPRESS_FILE_MOVE_FAILED')
Above command will return id and use this in next subsequent command. Let say command return id as 1.
2. update application_transformerarchivalaudit set status='COMPLETED' , repo_path="location_where_archival_move" where id =1
In above command "location_where_archival_move” is an offline storage path where archival is manually move.
For example, If you move archival “/opt/SNAPSHOT/ALPHA/2019/Jul/WINDOW_5/20190730.tar.gz" to offline storage /opt/ES_BACKUP/ALPHA/2019/Jul/WINDOW_5/20190730.tar.gz" then location_where_archival_move will be “/opt/ES_BACKUP/ALPHA/2019/Jul/WINDOW_5/20190730.tar.gz”
3. If the archival state in "RESTORE_ARCHVAL_COPYING", "RESTORE_ARCHIVAL_COPY_FAILED", "RESTORE_ARCHIVAL_READY_TO_DECOMPRESS", "RESTORE_ARCHIVAL_DECOMPRESSING", "RESTORE_ARCHIVAL_DECOMPRESS_FAILED" then try to reschedule restore snapshot by making it's state to "RESTORE_ARCHVAL_SCHDULED"
NOTE: Before updating Find out required id of the record in table use following SQL command.
1. select id from application_transformerarchivalaudit where status in ('RESTORE_ARCHVAL_COPYING','RESTORE_ARCHIVAL_COPY_FAILED,'RESTORE_ARCHIVAL_READY_TO_DECOMPRESS','RESTORE_ARCHIVAL_DECOMPRESSING','RESTORE_ARCHIVAL_DECOMPRESS_FAILED')
Above command will return id and use this in next subsequent command. Let say command return id as 1.
2. update application_transformerarchivalaudit set status='RESTORE_ARCHVAL_SCHDULED' where id =1
4. If the archival state is "RESTORE_ARCHIVAL_FAILED" then try to reschedule "RESTORE_ARCHVAL_SCHDULED" if again it gets failed then make it's state as "RESTORE_ARCHIVAL_NOT_AVAILABLE".
NOTE: Before updating Find out required id of the record in table use following SQL command.
1. select id from application_transformerarchivalaudit where status in ('RESTORE_ARCHIVAL_FAILED')
Above command will return id and use this in next subsequent command. Let say command return id as 1.
   2. update application_transformerarchivalaudit set status='RESTORE_ARCHVAL_SCHDULED' where id =1
      OR
      update application_transformerarchivalaudit set status='RESTORE_ARCHIVAL_NOT_AVAILABLE' where id =1
alert status is "archival_failed"
If the alert status is "archival_failed" and event is "archival process failed reach max retries".It means that snapshot archival process reached maximum retries and hence it will not launch the next snapshot. Please check the logs.
1. If snapshot archival failed due to connection error make its state as "SCHEDULED"
1. select id from application_transformerarchivalaudit where status in ('FAILED')
Above command will return id and use this in next subsequent command. Let say command return id as 1.
2. update application_transformerarchivalaudit set status='SCHEDULED' where id =1
2. If snapshot get failed due to shards failed then make its state as "SCHEDULED" and after rescheduling snapshot again if it gets failed then either delete bucket entry from a table or make its state as INDEX_NOT_FOUND
1. select id from application_transformerarchivalaudit where status in ('FAILED')
Above command will return id and use this in next subsequent command. Let say command return id as 1.
   2. update application_transformerarchivalaudit set status='SCHEDULED' where id =1
      OR
      update application_transformerarchivalaudit set status='INDEX_NOT_FOUND' where id =1
      OR
      delete from application_transformerarchivalaudit where id=1

