Difference between revisions of "KHIKA Alerts & Correlations"
(→Creating a Simple Alert: Logon Failure on Windows) |
(→Creating a Simple Alert: Logon Failure on Windows) |
||
| Line 216: | Line 216: | ||
|- | |- | ||
| Mail Ids || Enter the e-mail IDs of the recipients to receive e-mail intimation when this alert is triggered. Multiple e-mail IDs must be separated by comma.. | | Mail Ids || Enter the e-mail IDs of the recipients to receive e-mail intimation when this alert is triggered. Multiple e-mail IDs must be separated by comma.. | ||
| − | Note: KHIKA must be configured to send e-mails using SMTP protocol. Please refer to the section on | + | Note: KHIKA must be configured to send e-mails using SMTP protocol. Please refer to the section on [[SMPT Settings for KHIKA]] to enable KHIKA to send automatic e-mails. |
|- | |- | ||
| Email || Set e-mail to active if you want e-mail ID/s to be entered in Mail IDs field. | | Email || Set e-mail to active if you want e-mail ID/s to be entered in Mail IDs field. | ||
Revision as of 11:12, 18 June 2019
Contents
- 1 Introduction
- 2 Alert Dashboard
- 3 Creating your own Alerts in KHIKA
- 3.1 Before creating an alert
- 3.2 Creating a Simple Alert: Logon Failure on Windows
- 3.3 Slightly Advanced Alert: Multiple Logon failure on Windows for the same user
- 3.4 More Advanced Alert: 10 or more unique network connections for a windows host within 1 minute
- 3.5 Advanced Alert: A successful brute-force attack
- 4 Alert emails for Stakeholders
Introduction
Correlations and Alerting is one of the core functionalities of KHIKA. As KHIKA Core receives streams of data from KHIKA Data Aggregator/s, the incoming data has to be processed in “real time” and meaningful alerts have to be triggered when predefined conditions are met. The predefined conditions are called as “Alert/Correlation Rules” and the component of KHIKA responsible for processing these Correlation Rules is called “Alerting and Correlation Engine”
Consider “Alerting and Correlation Engine” as an inverted database that has queries (aka Alert/Correlation Rules) already defined and stored in it. As the data streams pass through the “Alerting and Correlation Engine”, the streams of data get validated against the predefined queries. As soon as the predefined conditions are met, the alerts are generated.
KHIKA’s state of art of alerting and correlation engine is built with complex event processing (CEP) at its core and hence it is capable of handling complex alerting requirements such as
- Several login failures followed by a successful logon for same user from same machine within 10 minutes (Successful brute force attack)
- Several packets dropped on firewall from same source IP address with more than 50 unique combinations of destination hosts and ports within 5 minutes
- User created and deleted within 24 hours
- User created but initial password not changed within 24 hours
- Communication with suspicious IP on firewall from a host followed by a virus alert from antivirus engine on the same host etc.
Note that these are complex alerting requirements as it involves correlating several events together to be able to generate a meaningful alert. For instance, to identify a successful brute force attack on windows, you must correlate several logon failure events (eventid = 4625) with a logon success event (eventid=4624) for the user in question within certain time period. Eventid 4625 may have different field to identify the same user from eventid 4624. Clearly, one must be able to do cross-event correlations on any field that may exist in the events.
Alert Dashboard
Click on “Alert Dashboard” on left menu pane. Certain alerts are pre-canned and shipped with KHIKA, keeping in mind the requirements of the users. Alerts that the system generates, can be seen in the “Alert Dashboard” as well as can be sent in email to relevant stakeholders.
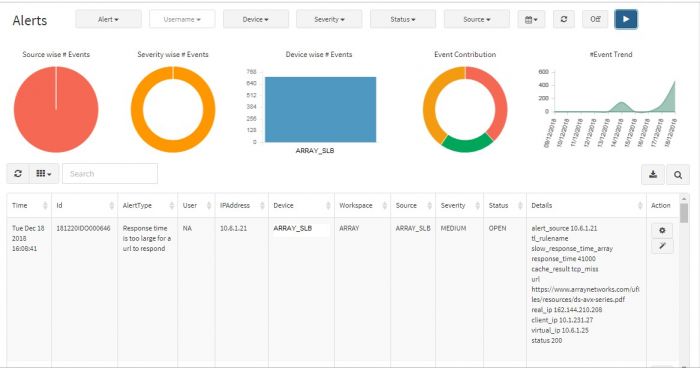
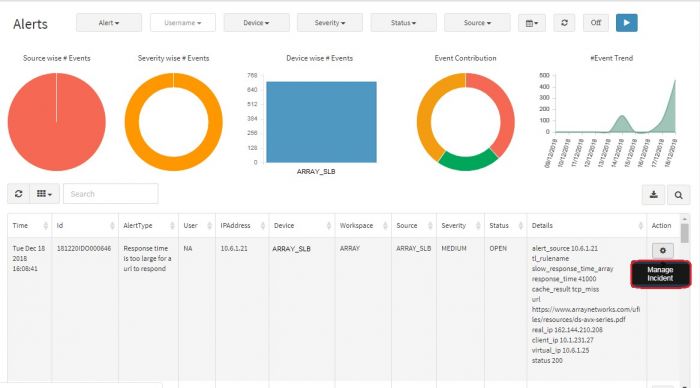
Alert Dashboard displays all the alerts generated by all the devices which are connected to the system. Visual representation in the form of Pie Charts, Bar Graphs, and Line Graphs are used for identifying the priorities, trends, problem IPs etc. easily. You can prioritize alerts based on severity and impact and focus on the critical incidents. Additionally, there are five filters provided on top as drop down menus to navigate and / or focus on a certain alert type or only “Critical” severity alerts say.
You can view a graphical representation of the alerts in the top half of the screen while the table below shows details of the event that pinpoint the exact IP addresses, URLs, Username involved. This is aimed to help the admin investigate and sort out the event.
Viewing & Filtering Alerts
You can view details of a particular alert by using following filters:
- Severity
- Alert
- Username
- Device
- Date range
- Status
- Source
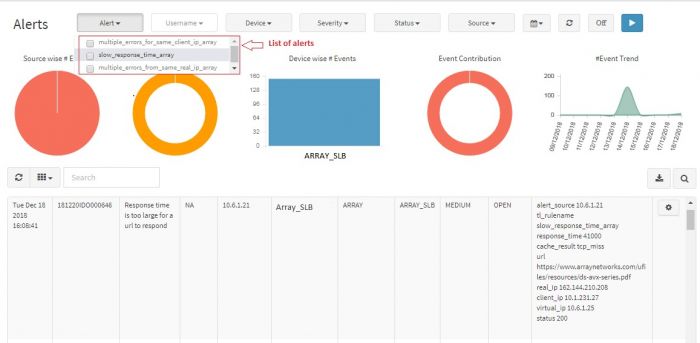
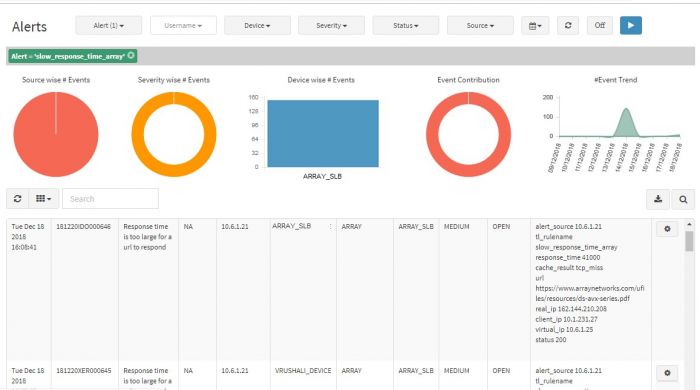
You can apply filters to any of these parameters and generate a graphical representation to see the trend. The filter also affects the tabular representation below the graphs. The table shows only those alerts for which you have applied the filter. To apply filters to each of the parameters and generate a chart follow these steps:
Select the appropriate details like Severity, Alert, Username, Device and Date Range.
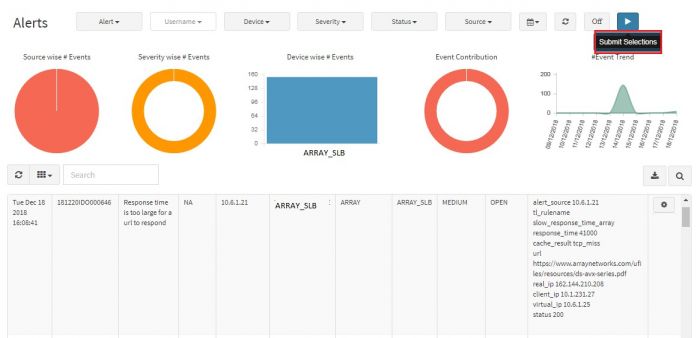
Click on Submit Selection button on the top right.
The selected filters are applied, and the chart is displayed.
Various fields in Alert Dashboard table are listed below:
| Field | Description |
|---|---|
| Time | Exact timestamp when alert is triggered in the system. |
| Id | Unique identifier of the alert.(This is for internal reference) |
| Alert Type | What the alert is about. |
| User | Username associated, if any. (default is NA) |
| IPAddress | IPAddress that raised the alert. |
| Device | Machine name (device) that raised the alert. |
| Workspace | Relevant Workspace name which has the devices, events associated. |
| Source | Data source of the alert (like APV, VPN, Firewall etc.) |
| Severity | Severity of the alert. |
| Details | Description of the alert, not mentioned in other fields. |
You can search a particular alert by entering any of the field details in the search option. The search option returns all the details of the particular alert.
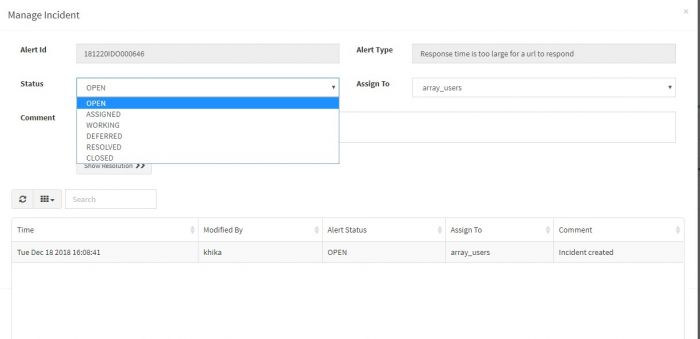
You can manage an incident by assigning it to another group to verify and handle the condition. Also you can change the status of the incident according to your workflow.
Click on Manage Incident button.
Select the status and user group for incident. You can assign an incident to a user group.
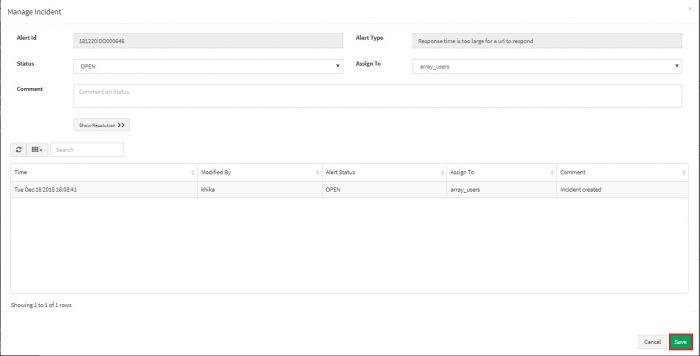
Write a comment if any. Click on Save button
You can check the current status of the incident in the Alert Dashboard.
The best way to understand how Alerting works is learning by examples. In the section below, we will begin with some very simple examples and slowly show how to create complex alerts/correlations in KHIKA.
Creating your own Alerts in KHIKA
Before creating an alert
Before creating your alerts, we highly recommend you become familiar with the data by exploring various fields and their values. Use the Discover functionality, to become familiar with your data. Please make sure that all the fields in raw data required for your alerts are being sent to alerting engine. KHIKA does not send all the fields for alerting by default. You may enable it explicitly. This can be verified by performing following steps. To check the fields,
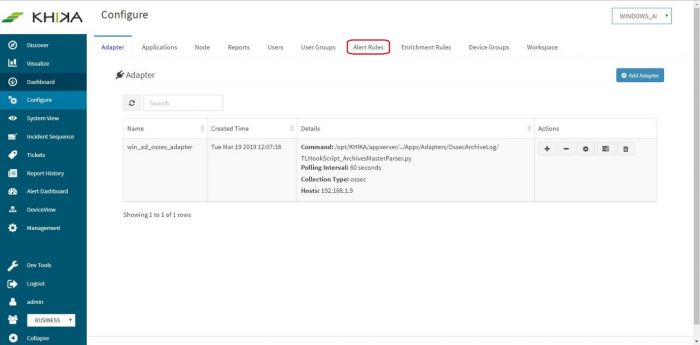
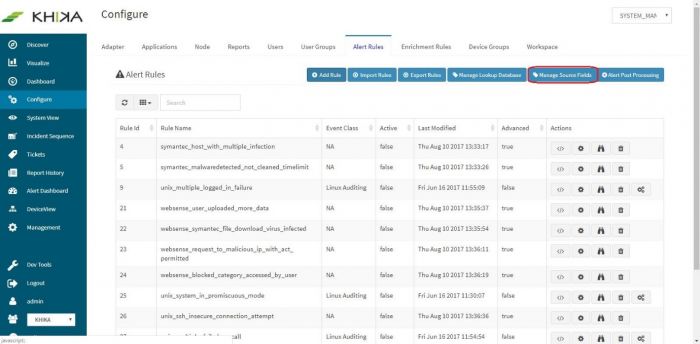
Go to Configure and then “Alert Rules” tab
Click on “Manage Source fields” button
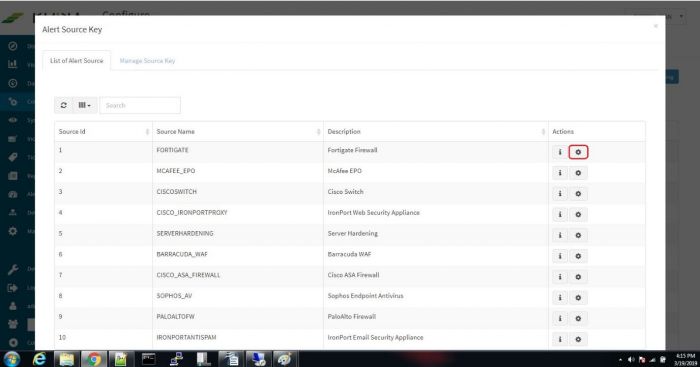
List of Source Names is displayed. Click on “Update Source keys” button of say, “FORTIGATE” which stands for Fortigate Firewall Log.
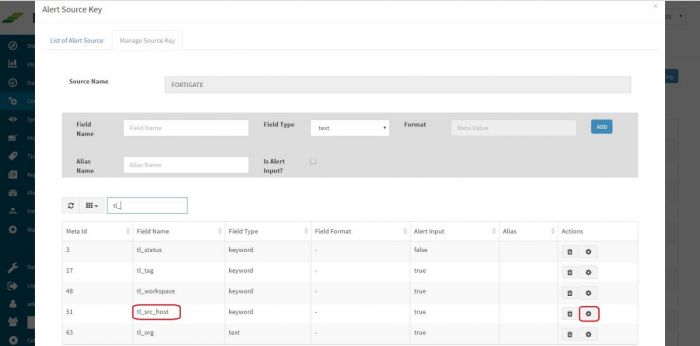
Here fields with “Alert input” true are being sent to alerting engine. If you want to change “Alert input” of particular field. Click on “Modify key meta” button of that particular field (Here I’m selecting it for tl_src_host)
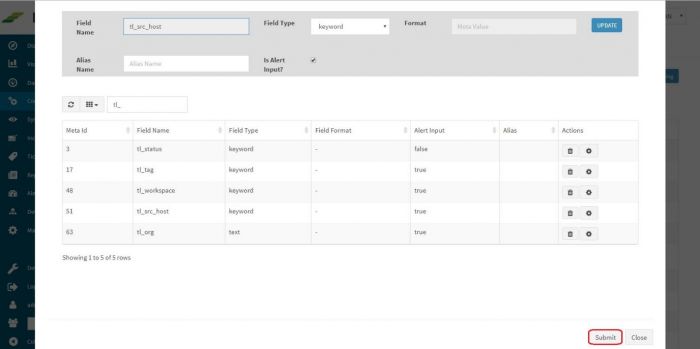
The field will appear in Field Name textbox, select “Is Alert input?” checkbox. and click on Update
After doing it for all the required fields. Click “Submit” button at the bottom.
Creating a Simple Alert: Logon Failure on Windows
Consider a very simple case of generating an alert when a user fails to logon on a windows server. We know that eventid 4625 indicates “logon failure” on windows. Perform following steps in KHIKA:
- Logon as an admin user
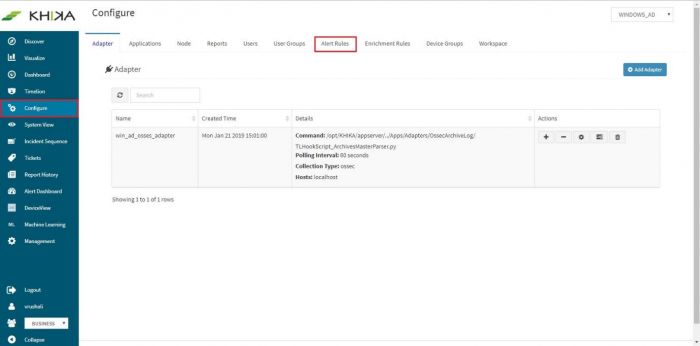
- Click “Configure” -> “Alerts Rules”
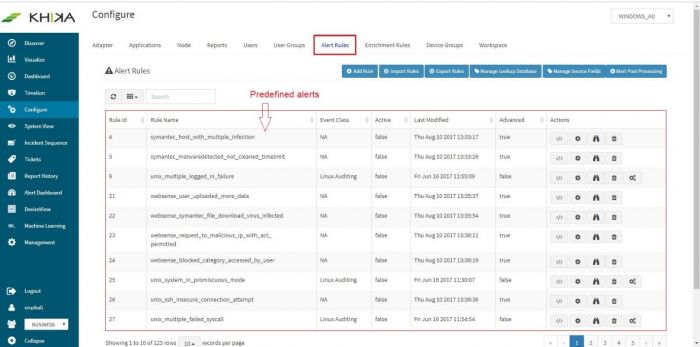
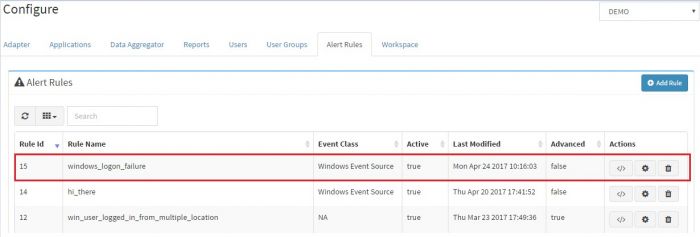
Predefined alerts in KHIKA will show up in the window (we recommend you to study these alerts).
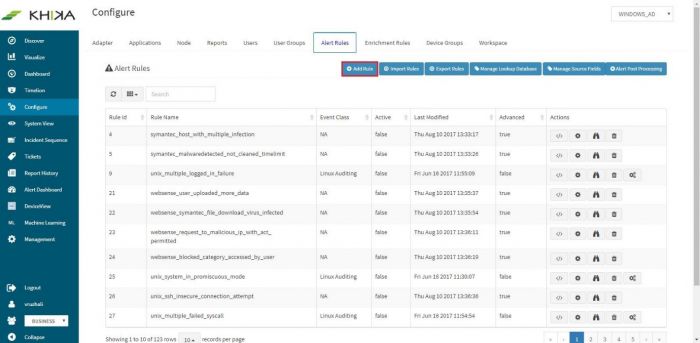
Click on “Add Rule” button for creating new alert rule.
“Configure Rule” page will pop-up in browser.
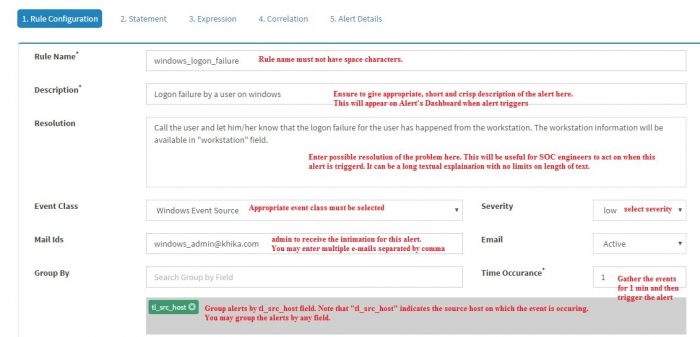
The first tab is “Rule Configuration” tab that captures basic information about the alert rule.
Enter details in the screen, details of fields on the screen are shown in the table below :
| Fields | Description |
|---|---|
| Rule Name | Enter appropriate “Rule Name” here. Note that the rule name must not have any space characters in it. |
| Description | Enter appropriate description here. This description will appear on Alert Dashboard when the alert triggers. |
| Resolution | (optional) Enter a possible resolution in this field so that a SOC engineer will be able to take action on this alert whenever it triggers |
| Event Class | The event source on which this alert has to be configured. In this example it is set to “Windows Event Source” |
| Severity | The severity of the alert. Alerts with severity "Info" are not displayed on the alert dashboard to avoid flooding the dashboard and emails of stakeholder receivers |
| Mail Ids | Enter the e-mail IDs of the recipients to receive e-mail intimation when this alert is triggered. Multiple e-mail IDs must be separated by comma..
Note: KHIKA must be configured to send e-mails using SMTP protocol. Please refer to the section on SMPT Settings for KHIKA to enable KHIKA to send automatic e-mails. |
| Set e-mail to active if you want e-mail ID/s to be entered in Mail IDs field. | |
| Group By | Set the group by field to tl_src_host from drop down. After you select the field it will appear in the box below Group By. You may enter multiple fields here if you want to group by the events hierarchically for the alert to be triggered. |
| Time Occurance | Within what time window the event(s) or pattern of events occured. |
After entering this value click “Add Statement(s)” button or click on “Statement” tab, or click on “Add Statement button towards the bottom of this window. Donot click on Submit, as yet.
You must have at least one statement in any alert rule.
(You can have multiple “Statements” if you wish to correlate multiple events together. We will explain this in another example ahead)
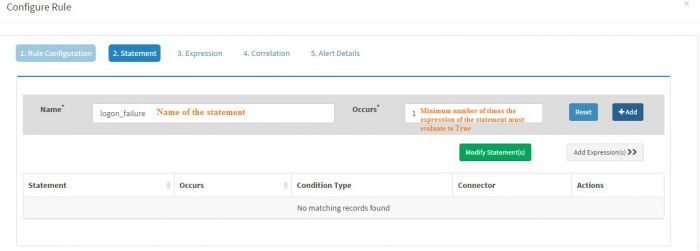
“Statement” must have a “Name” and the value of Name should not have any space characters in it. We entered “logon_failure” in this case as the name of our statement.
“Occurs” field of every statement must have a numeric value. This value indicates minimum number of times the expression/s of the statement must evaluate to true for the rule to fire or for next statement to be evaluated. In this case we have set this value to 1 as we want to fire the alert for every single logon failure event.
Click “Add” to add this statement. The statement will appear in the “Statement” table below.
Click “Expression” tab or “Add Expression(s)” button to add expression to this statement.
Every “Statement” must have one or more expression/s associated with it.
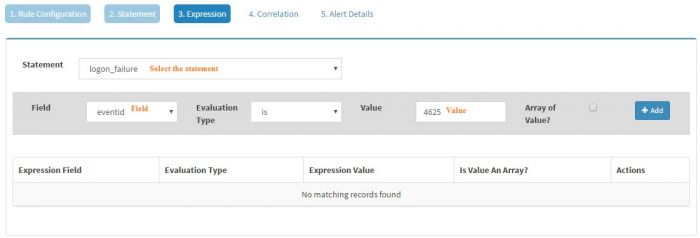
Select the statement (In this case, we just have one statement i.e. logon_failure) and then select the field of interest. KHIKA will populate the fields depending on the Event Class selected. As we have selected Windows Event Source as the Event Class, we will get all the fields from windows events in the drop down. We have selected “eventid” field as we want to generate an alert for logon_failure event and we know it is clearly identified by eventid 4625. The evaluation type is selected as “is” and Value is set to “4625”
Click “Add” to add the expression to this statement.
We can have multiple expressions for a single statement. However, in this example we just need one single statement.
We do not have to add any correlations in this case so click Alert details.
The “Alert Details” page captures additional details to be displayed for the generated alerts. You have to populate Name and Field pairs for the capturing the additional details.
Enter a “Label” in the Name box and select a “Value” from the dropdown for the Field and click Add for each Label-Value pair. We have selected three Label-Value pairs which we feel will capture valuable information for this alert. User is set to user_name (to know the user for which logon failed), device is set to tl_src_host (capture the server on which this event occurred) and machine_name is set to network_information_workstation_name (it is useful to know the workstation from which logon attempt was made).
Names “alert_source” and “device” have to be present in the Names field, in addition to other name and field pairs.
Click “Submit” button to save this alert. You will see the newly created alert in the “Alert Rules” tab
To deactivate the alert, click modify icon to open the “Modify Rule” page. Unselect “Active” radio button to disable the alert
Slightly Advanced Alert: Multiple Logon failure on Windows for the same user
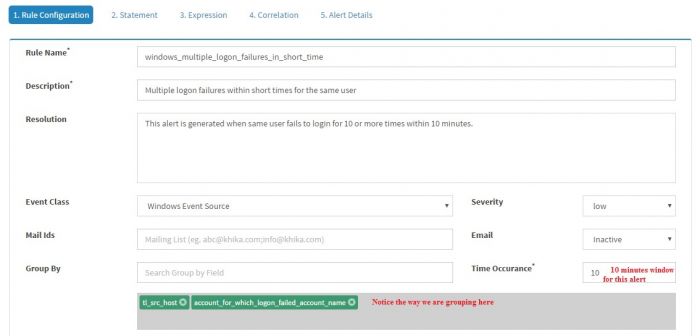
In the last example, we demonstrated creating a simple KHIKA Alert rule. Soon we will realize that it will generate a lot of alerts and it is really not very useful to have an alert/e-mail for every logon failure. Let us try to write a new rule which will alert when 10 logon failures happen for a same user within 10 minutes. Click “Add Rule” and enter the information as shown in the screenshot
Note that “Time occurrence” is set 10 minutes and “Group By” is set to tl_src_host and account_for_which_logon_failed_account_name.
Click “Add Statement” to add following statement for this rule
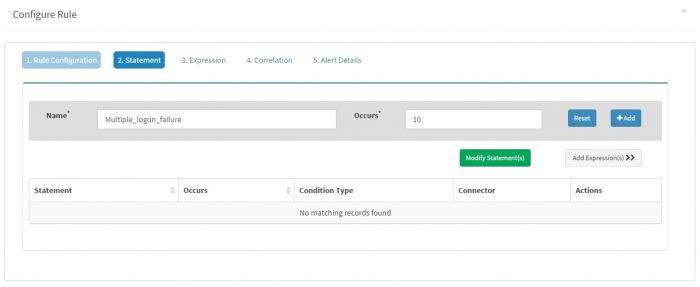
Name is set to “multiple_logon_failure” and Occurs is to 10 as we want minimum 10 logon failures to happed with 10 minutes
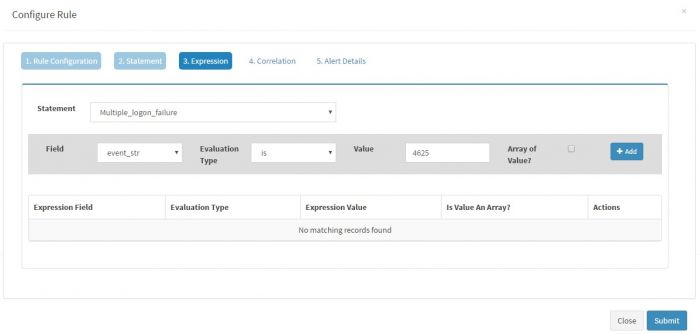
Click “Expressions” to enter following simple expression for the Statement of this rule.
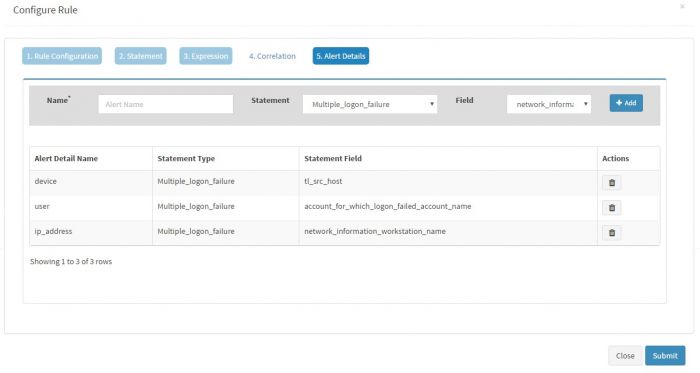
Skip correlations and enter “Alert Details” for this alert.
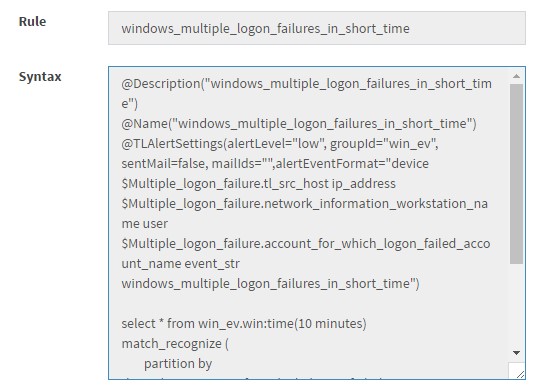
and click “Submit” The Rule will be created in KHIKA. You can check the created EPL statement for the same by clicking “show syntax” icon ialert1
More Advanced Alert: 10 or more unique network connections for a windows host within 1 minute
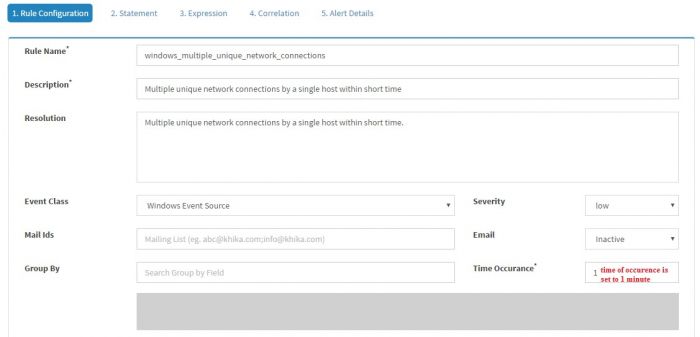
We will be using windows firewall event 5156 for this sample rule. Click “Add Rule” and enter following information.
Time Occurrence in minutes is set to 1 as we are looking for unique connections within 1 minute.
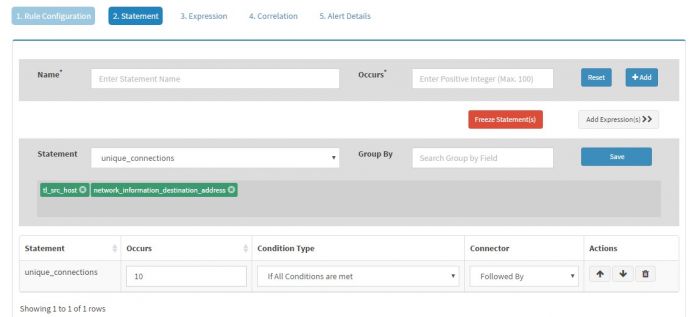
Click “Add Statement(s)” to add a statement to this Rule
Give Name to the Statement as “unique_connections” and set Occurs to “10” as we want at least 10 (or more) connections. Click “+Add” button to add this statement and then click “Modify Statement”. For Statement “unique_connections” set Group By to “tl_src_host” followed by “network_information_destination_address”
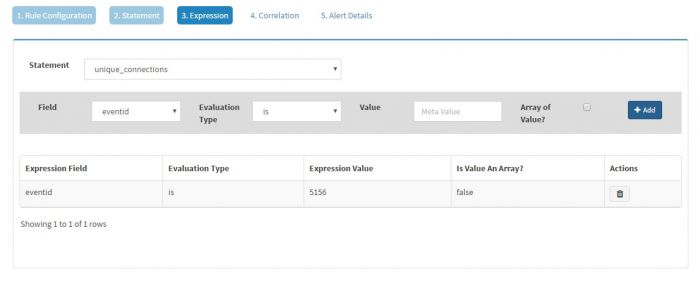
Click Expression and add an expression for this statement setting it to eventid equal to 5156 as shown below
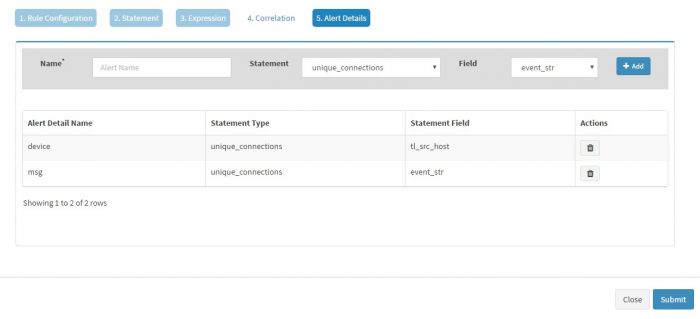
Skip correlations and set “Alert Details” shown below
Click “Submit” to store this rule. Verify this rule by “View Syntax” or reading it from /opt/KHIKA/alertserver/rule directory where this rule file is saved.
Advanced Alert: A successful brute-force attack
A successful brute force attack is combination of multiple logon failure events (eventid = 4625) followed by a successful logon event (eventid = 4624) for the same user within a predefined time period. An attacker usually identifies a username and tries multiple passwords for the username. While doing this, the attackers fails multiple times as he/she is trying to guess the password. If the password is weak, attacker is successful after certain number of unsuccessful attempts.
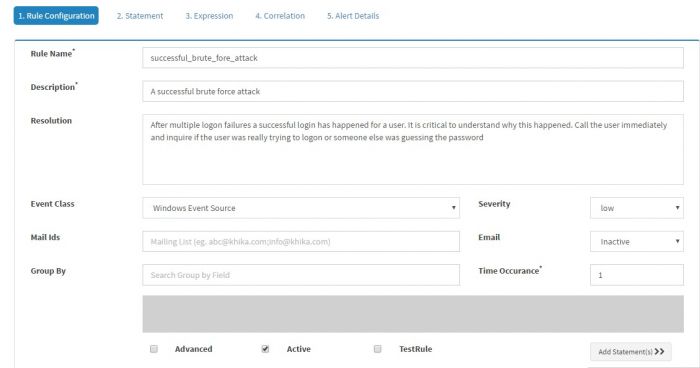
Click “Add Rule” and enter the required information on the first page
Leave Group By field vacant in this case and click “Add Statement”.
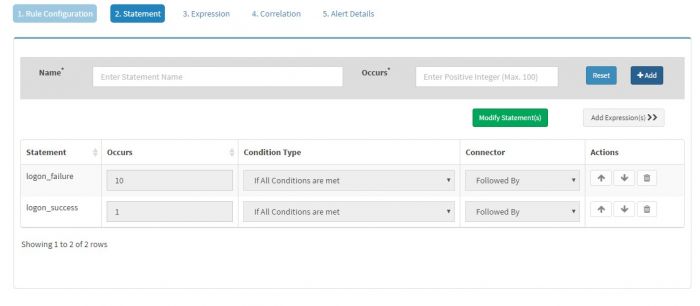
We will be adding two statements in this case, first for logon_failure and second for logon_sucess as shown below
“Occurs” value for logon_failure and logon_success statements is set to 10 and 1 respectively.
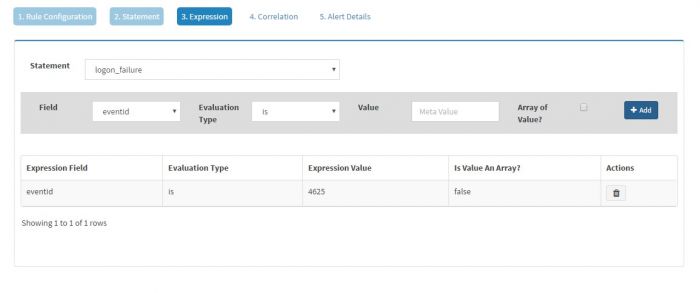
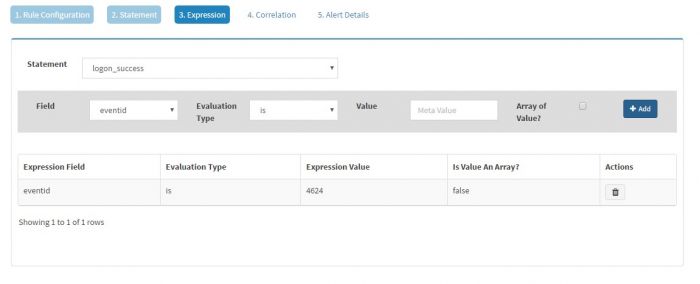
Click on Expressions to add expressions for each of the two statements.
For logon_failure, add eventid = 4625
And For logon_success, add eventid = 4624
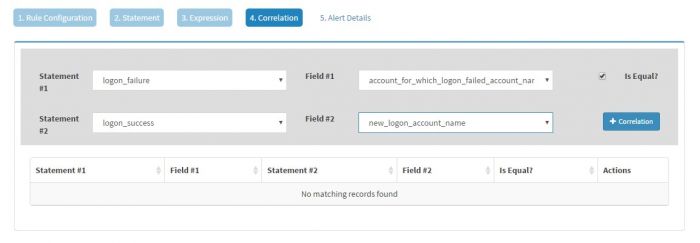
Click Correlations to create correlations on two statements, logon_failure and logon_success
For logon_failure select the field “account_for_which_logon_failed_account_name”. You must know that the user name for which logon failure has happened is available in field “account_for_which_logon_failed_account_name” for eventid 4625
Make sure to tick “Is Equal” and for logon_success set the value to “new_logon_account_name”. You must know that the user name field for which logon success has happened is available in field “new_logon_account_name” for eventid 4624
Click “+Correlations” to add the correlation statement.
Note that we are correlating two events by equating the value for the user which is getting captured in two distinct fields.
You can add multiple correlation conditions one below the other. For the Rule to fire, all the conditions must be satisfied. In this case, we stop at first condition.
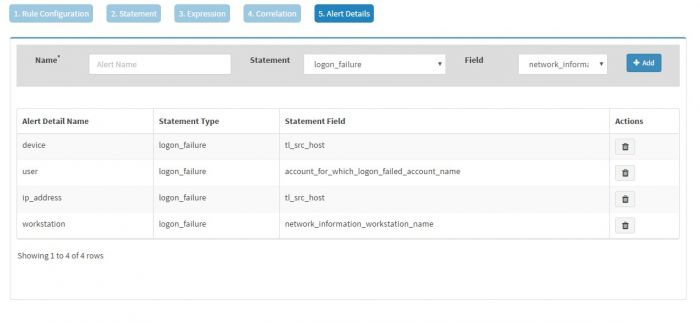
Click “Alert Details” to capture the Alert Details
And click Submit to save the rule.
Alert emails for Stakeholders
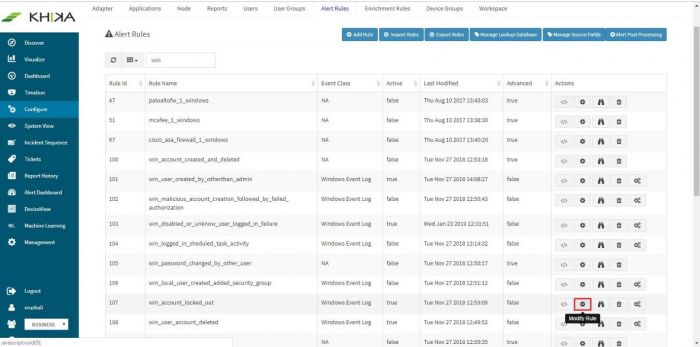
Go to Configure – Alerts. Select the alert rule from the list, for which you want to receive emails. Next to the alert rule, click on “Modify Rule” icon.
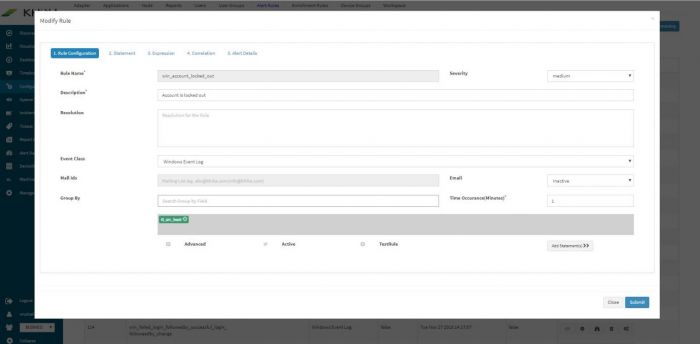
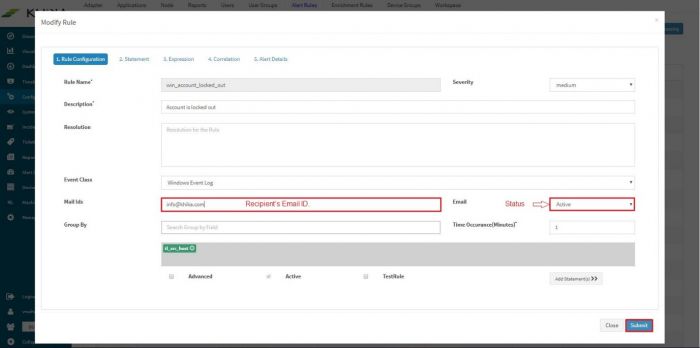
The Modify Rule window pops up.
Towards the end of the window there is a field “Mail Ids” for entering appropriate recipient’s email id. Also select “Active” from the “Email” dropdown to activate this feature. Click on Submit.
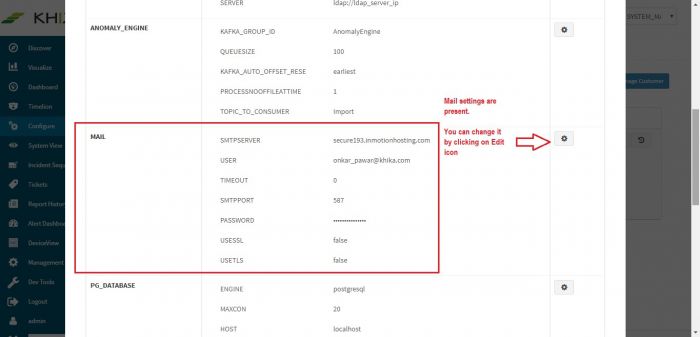
An email shall be sent everytime an alert is raised now onwards. However please note : A dedicated KHIKA email id for outgoing emails for this purpose has to be created by the client user. Smtp settings have to be configured in KHIKA Application Server, for this email id created. You can check if the settings are configured, as follows :
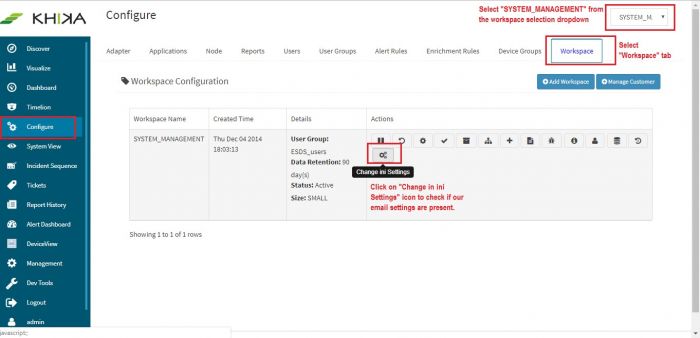
- Go to Configure from the left menu.
- Select “SYSTEM_MANAGEMENT” workspace from the workspace dropdown on top left.
- Select “Workspace” tab from the multiple tabs.
- Click on “Change ini Settings” icon
Window opens for “Advance options for Configuration Settings”. We can check here if email settings are done.
Go to the next section for more on KHIKA Adapters
